

Cloud Storage Cost Calculator
The Cloud Storage Cost Calculator compares what you'd pay for the same workload on AWS S3, Azure Blob Storage, and Google Cloud Storage. Enter your Data Volume, Storage Tier, Monthly Read Requests, Monthly Write Requests, and Monthly Egress, then click Compare Costs to see a side-by-side breakdown of monthly storage, request, and egress fees — plus annual and 3-year TCO totals. Prices reflect approximate US East / West Europe rates for 2024–2025. Also see: RAID Calculator.
Results
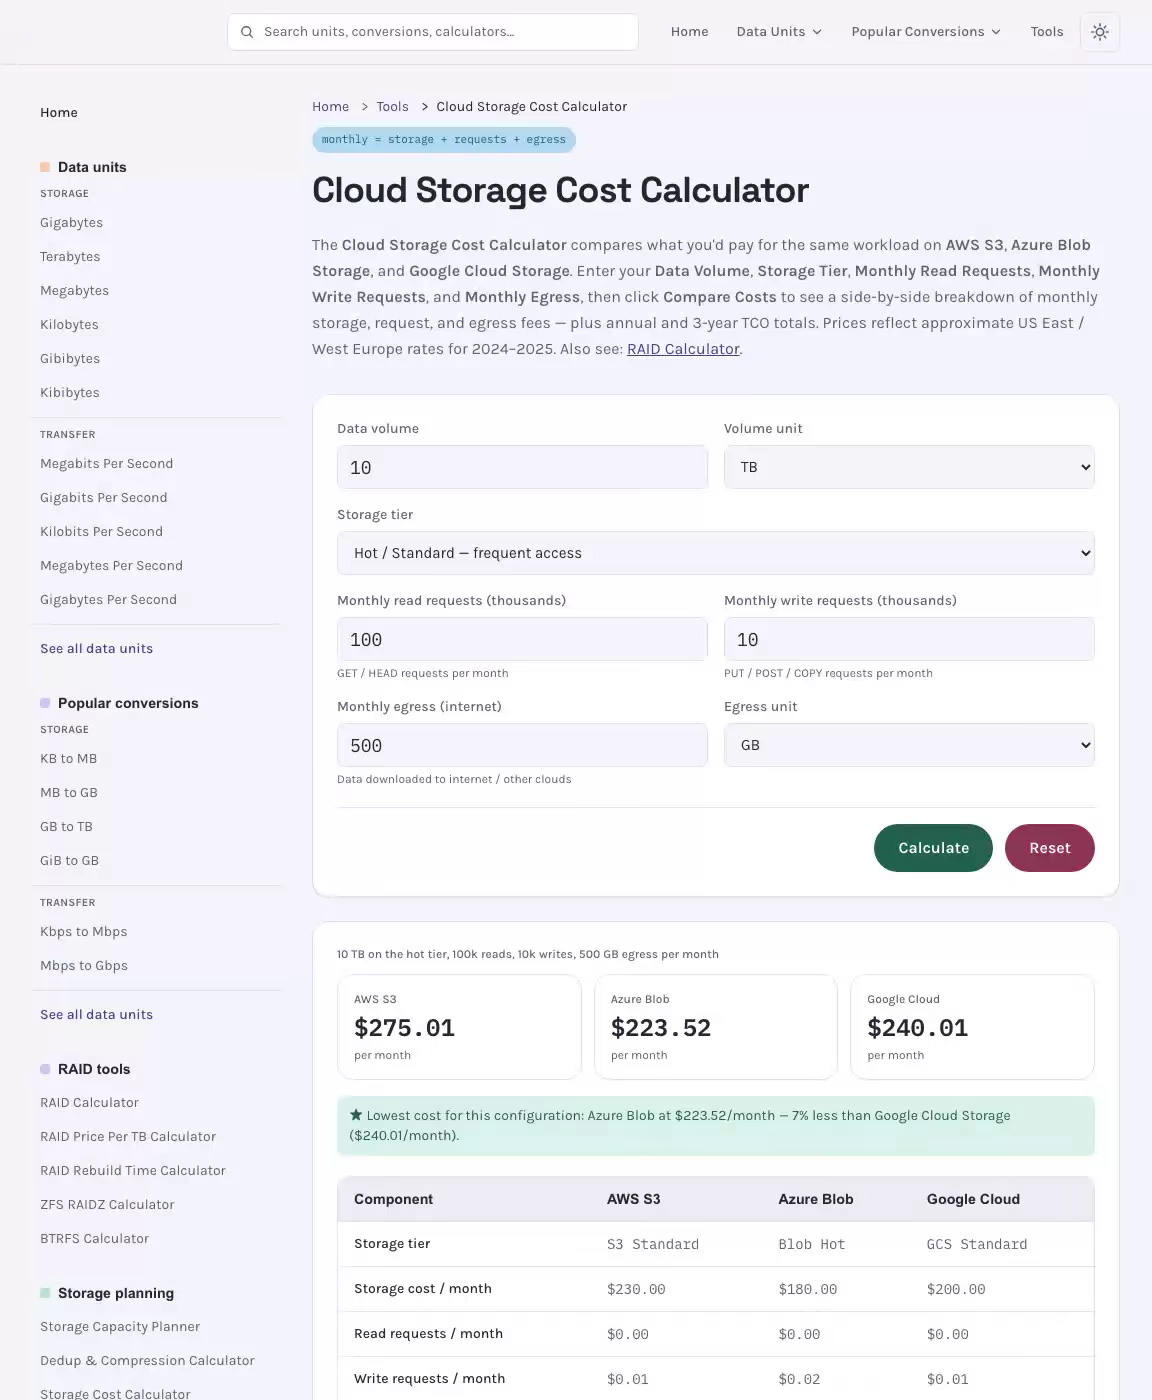
10 TB on the hot tier, 100k reads, 10k writes, 500 GB egress per month
AWS S3
lowestper month
Azure Blob
lowestper month
Google Cloud
lowestper month
★ Lowest cost for this configuration: Azure Blob at $223.52/month — 7% less than Google Cloud Storage ($240.01/month).
| Component | AWS S3 | Azure Blob | Google Cloud |
|---|---|---|---|
| Storage tier | S3 Standard | Blob Hot | GCS Standard |
| Storage cost / month | $230.00 | $180.00 | $200.00 |
| Read requests / month | $0.00 | $0.00 | $0.00 |
| Write requests / month | $0.01 | $0.02 | $0.01 |
| Egress cost / month | $45.00 | $43.50 | $40.00 |
| Total / month | $275.01 | $223.52 | $240.01 |
| Total / year | $3,300.11 | $2,682.26 | $2,880.11 |
| 3-year TCO | $9,900.32 | $8,046.79 | $8,640.32 |
AWS S3, Azure Blob, GCP GCS and Backblaze B2 Pricing Tiers
| Tier | AWS S3 ($/GB/mo) | Azure Blob ($/GB/mo) | GCS ($/GB/mo) | Min Duration | Best For |
|---|---|---|---|---|---|
| Hot / Standard | $0.0230 | $0.0180 | $0.0200 | None | Frequent access, production data |
| Cool / Standard-IA | $0.0125 | $0.0100 | $0.0100 | 30 days | Backups accessed monthly |
| Cold / Glacier Instant | $0.0040 | $0.0045 | $0.0040 | 90 days | DR copies, rarely accessed backups |
| Archive / Deep Archive | $0.00099 | $0.00099 | $0.00120 | 180 days | Long-term compliance, yearly backups |
Prices are approximate US East / West Europe rates as of 2024–2025. Actual prices vary by region and change frequently — verify at each provider's pricing page before committing.
Storage Fees, Egress Charges, API Calls and Retrieval Costs Explained
Ever stared at a cloud invoice and wondered how a simple storage bucket ballooned into a four-figure monthly bill? The Cloud Storage Cost Calculator gives you transparent, provider-level cost breakdowns before you commit a single byte to the cloud — empowering your team to make smarter architecture decisions, set realistic budgets, and eliminate the bill-shock that derails financial planning cycles. Whether you are a startup looking to estimate cloud spend for the first time or a DevOps engineer validating resource configurations ahead of a production launch, having an accurate cost estimate in hand changes everything.
See the Cloud Storage Cost Calculator in Action
How Cloud Storage Pricing Works: A Complete Cloud Storage Cost Calculator Reference
Pricing is not a single line item — it is a layered billing model that combines multiple dimensions, each of which can silently inflate your monthly bill if left unexamined. Understanding each dimension puts you in control of your spend and makes every estimate you generate far more actionable. Cloud computing has made it easier than ever to scale capacity, but that same elasticity makes cost comparison across providers essential. Related: ZFS RAIDZ Calculator.
At its core, every major provider — AWS, Google Cloud, Microsoft Azure, Oracle Cloud, IBM Cloud, and Alibaba Cloud — structures charges around four primary cost drivers:
- Volume: The raw amount of data you keep, charged per GB each billing cycle. This is the most visible line in your bill, but rarely the largest for active workloads.
- Data transfer (egress fees): What you pay when downloading data out to the internet or moving it between regions. Uploads are usually free, but transfer out costs between $0.08 and $0.12 per GB on most platforms — and they compound fast.
- API operations: Every file operation — uploading, downloading, listing, or deleting — triggers an API request. Providers charge per thousand requests, with write operations (PUT and POST requests) costing more than read operations (GET and LIST requests).
- Retrieval fees: Cold and archival tiers charge an additional retrieval fee when you access data, offsetting their lower base rate.
Storage Costs by Provider Across Cloud Costs and Storage Classes
Every provider tiers its storage class pricing by access frequency, which is also called storage temperature. Hot storage — such as AWS S3 Standard, Google Cloud Storage Standard, or Azure Blob Hot — is optimised for frequently accessed data and carries the highest per-GB rate but no retrieval fees. Cold tiers like AWS S3 Glacier Instant Retrieval, Google Cloud Storage Nearline, or Azure Blob Cool trade a lower rate for moderate retrieval fees. Archival classes — including AWS S3 Glacier Deep Archive and Google Cloud Storage Archive — deliver the cheapest GB stored pricing but impose the highest retrieval fees and multi-hour restore windows, making them ideal for long-term backups.
To illustrate with a real example: a startup keeping 5 TB of media assets on AWS S3 Standard in the us-east-1 region would pay approximately $0.023 per GB, totalling around $117.76 monthly for capacity alone. Add 500,000 GET requests at $0.0004 per thousand ($0.20) and 500 GB of egress fees to end users at $0.09 per GB ($45.00), and the projected figure rises to roughly $162.96 each month — a number that surprises many teams who only budget for raw data volume and forget about internet transfer and API operations entirely.
Data Transfer and API Operations: The Hidden Pricing Drivers
Data transfer fees are consistently underestimated during budget planning. When your application serves content directly from object repositories — streaming video, distributing software packages, or delivering user-generated content — the egress fees can dwarf your base capacity costs within weeks. Every GB of data transfer out counts, whether it flows to end users over the internet, moves across regions, or crosses availability zones. This is why a thorough cost comparison before committing to a provider is so valuable for team collaboration between engineering and finance.
API requests accumulate in ways that are equally easy to overlook. A microservice that polls a bucket for new files every few seconds generates millions of read requests each billing period. At AWS S3 rates, GET requests cost $0.0004 per thousand and PUT requests cost $0.005 per thousand — individually trivial, collectively material. Write operations in particular add up during active uploading phases. Using an estimation tool to model your expected read requests, write requests, and data retrieval volumes before provisioning is the single most effective way to avoid cost overruns tied to API operations.
Regional Pricing Differences That Affect Your Monthly Bill
Regional pricing is one of the most impactful and least discussed dimensions of capacity cost. US regions — particularly us-east-1 and us-west-2 on AWS — consistently offer the most competitive rates. European regions carry slightly higher rates reflecting data sovereignty setup costs. Asia-Pacific, Middle East, and South America regions often apply a premium of 10–30% above equivalent US rates due to localised investment and demand patterns.
Choosing regions close to your users delivers better performance and can reduce egress fees between the data layer and your compute tier. Currency and region-specific pricing also matter for multinational organisations: the Google Cloud pricing calculator, for example, lets you sign in to view billing account pricing in multiple currencies and apply currency adjustment for local financial planning. Always cross-reference estimated prices against official documentation from your provider, since commitment discounts, volume agreements, and promotional credits can materially shift your real costs relative to publicly available pricing.
What a Pricing Calculator Covers: Provider-Specific to Multi-Cloud Estimation
A robust pricing calculator goes beyond generating a single number — it models the interaction between storage class, usage patterns, access frequency, region, and discounting mechanisms to produce figures your finance teams, engineering teams, and operations teams can all act on. This kind of cloud optimization starts with understanding what each type of estimator covers, which helps you choose the right tool for your scenario.
Provider-Specific Calculators vs. Multi-Cloud and Open-Source Calculators
Provider-specific calculators — such as the AWS Pricing Calculator, the Google Cloud pricing calculator, and the Azure pricing calculator — offer the deepest accuracy for single-provider scenarios. You can configure products at a granular level: select a tier, input your data volume in GB or TB, set your expected read requests and write requests volumes, choose a geographic region, and open detailed view of projected costs. The Google Cloud pricing calculator allows you to add products, configure each service, then download a CSV of your estimate to share with your team. You can also duplicate estimates using the new from duplicate feature, and sign in to apply billing account pricing and committed use discounts specific to your account.
Third-party multi-cloud calculators and open-source tools — including solutions similar to Infracost — solve a different problem: they let you compare pricing across AWS, Google Cloud Storage, Azure Blob Storage, Oracle Cloud, IBM Cloud, Alibaba Cloud, and Backblaze B2 in a single interface. This makes side-by-side cost comparison possible without manually switching between four different pricing consoles. For teams evaluating a migration or building a multicloud architecture, this capability is invaluable. Infracost-style tools also integrate directly into your CI/CD pipeline, generating immediate cost feedback on pull requests before new resources are provisioned — a discipline known as shifting FinOps left with real-time pricing updates.
Resource Selection, Configuration, and Billing Options
Getting an accurate projection requires careful resource selection and configuration. A good estimator prompts you for:
- Tier selection: Choose hot storage, cold storage, or an archival class based on how frequently accessed your data will be.
- Data volume: Enter the quantity of GB you expect to maintain each billing cycle.
- Data transfer out: Estimate your monthly egress in GB — this is where most budget overruns originate.
- API operations: Input your expected read operations and write operations volumes, measured per thousand requests.
- Region: Select the geographic region closest to your users to balance performance and cost.
- Pricing model: Choose between on-demand pricing, reserved instances, savings plans, or committed use discounts to reflect your actual billing arrangement.
Many large-organisation-grade estimators also factor in the power of servers and virtual machines for hybrid scenarios, as well as networking services, managed services, databases, and containers — making them useful beyond pure capacity cost estimation and into broader planning for your technical setup.
Discounting Mechanisms and Pricing Models That Shape Projections
Discounting mechanisms are where projected figures diverge most sharply from real invoices. On-demand pricing reflects the published list rate with no commitment. Reserved instances and savings plans — available on AWS — offer discounts of 30–72% in exchange for one- or three-year commitments. Google Cloud offers committed use discounts with similar economics. Azure provides reserved capacity and enterprise agreements for large organisations. Volume discounts apply automatically once you cross certain usage thresholds on most platforms.
Spot instances are another lever for cost-effectiveness on compute-heavy workloads, though they are less applicable to persistent object repositories. For data retention specifically, the biggest optimisation levers are rightsizing your tier to match actual access patterns, and enabling lifecycle policies that automatically transition data from hot storage to cold storage or an archival class as it ages — reducing your bill without any manual intervention.
Connecting Cost Estimates to FinOps and Governance Workflows
Generating a projection is only the beginning. The real value of a cloud storage cost calculator emerges when its outputs flow into your broader FinOps processes, governance policies, and financial management workflows — turning a one-time number into a continuously validated planning asset.
Integrating Calculator Output with FinOps Platforms and Billing Workflows
Modern FinOps platforms and management tools — including CloudHealth, Apptio Cloudability, and AWS Cost Explorer — consume projection data as inputs for budgeting and forecasting. When your estimator outputs a CSV (as the Google Cloud pricing calculator's download CSV feature does), you can import that file directly into your cost management tooling to establish baseline budgets before a single resource is provisioned. This gives finance teams and operations teams a shared reference point for cost expectations and prevents the misalignment between projected resource needs and actual expenditures that typically surfaces at month end.
Real-time monitoring and reporting tools then track real costs against your projection throughout the billing period, enabling rapid course correction. Cost allocation through tagging strategies — aligned to your governance policies and organisational policies — ensures that every bucket's bill rolls up to the right team, department, or product line for accurate chargeback and showback reporting. Internal cost allocation clarity is fundamental to cloud economics maturity, and it directly supports the cost details visibility that finance stakeholders need.
Budgeting, Forecasting, and Cost Optimization Strategies
The most effective budgeting practice is to run scenario planning before every major provisioning decision. Rather than estimating a single configuration, model multiple scenarios: what does your bill look like at 10 TB, 50 TB, and 200 TB of retained data? How does switching from hot storage to a nearline tier affect your final figures when retrieval frequency drops below a threshold? Scenario modeling surfaces the inflection points where changing a tier or region delivers disproportionate savings.
For teams with variable workloads, usage assumptions deserve particular scrutiny. A DevOps team preparing to launch a new microservice that retains and serves artefacts should model peak usage patterns, not average usage. If the service generates 10 million PUT requests and 50 million GET requests during a release window, that API operations spike will appear in the bill — and catching it during the coding process rather than after deployment is exactly what shifting FinOps left is designed to achieve. Tools like Infracost embed projections directly into pull requests, providing immediate cost feedback to engineers before resource approval is granted.
Best practices for effective cost optimization strategies include:
- Accuracy validation: Compare your estimated prices against real invoice data quarterly. Dynamic pricing changes and usage pattern shifts mean your figures require regular updates to remain reliable.
- Rightsizing tiers: Audit access logs to confirm that data classified as frequently accessed actually is — misclassified hot storage is one of the most common sources of avoidable spend.
- Resource consolidation: Identify redundant buckets across environments and merge them to reduce per-bucket fixed costs and simplify visibility.
- Commitment planning: Once your baseline usage is stable, reserved instances or savings plans almost always outperform on-demand pricing for predictable data-retention workloads.
- Egress architecture review: Restructure data access patterns to minimise transfer out — for example, serving assets through a CDN rather than directly from object repositories reduces egress fees dramatically.
Aligning Estimates with Cloud Governance Policies and Products
Cloud governance requires that every new set of resources — including buckets, virtual machines, networking services, and managed services — passes a cost review gate before deployment. Embedding your cloud storage cost calculator output into this approval workflow closes the gap between cost projections and the finance team's budget expectations. It also supports adherence to organisational policies that mandate pre-provisioning cost reviews, a practice increasingly required under formal adoption frameworks.
Collaborative usage across teams is critical here. Engineers need the ability to share figures with architecture reviewers and finance stakeholders — and the best estimators support this natively, letting you share with team members via a link or exported document. Designating a regular cadence for reviewing and refreshing projections — particularly when providers announce pricing changes — maintains the integrity of your forecasting and prevents baseline budgets from drifting out of alignment with actual billing realities. For teams operating under regulatory requirements, verifying that your estimation tool reflects eligible services and their associated pricing is an additional cloud governance checkpoint worth building into your workflow. Custom price arrangements negotiated with providers for large-scale spending should also be factored in, as they may differ substantially from the publicly available pricing that most estimators reference.
Frequently Asked Questions About Cloud Storage Cost Estimates
How accurate are cloud storage cost estimates compared to real invoices?
Projected figures generated by any pricing calculator — whether provider-specific or third-party — are based on publicly available pricing and the usage assumptions you provide. They will not capture account-specific discounts, volume agreements, promotional credits, or dynamic pricing changes applied at the billing account level. Treat your estimate as a directionally accurate planning input rather than an exact forecast, and always validate it against your actual costs once a billing cycle has elapsed. Accuracy validation against real invoices is the only way to continuously improve the quality of your usage assumptions.
Which provider is cheapest for a given use case?
The answer depends heavily on your specific usage pattern. Backblaze B2 and Cloudflare R2 consistently offer the lowest egress fees — Cloudflare R2 charges zero for transfer out, which makes it extremely competitive for high-egress workloads. For infrequently accessed backup data, comparing Google Cloud Storage Nearline versus Azure Cool Blob Storage is instructive: a mid-size company retaining 50 TB of backup data across two regions might find that Google Cloud Storage Nearline comes in at approximately $0.01 per GB ($512 monthly for capacity) with $0.01 retrieval fees, while Azure Cool Blob Storage runs $0.015 per GB ($768 monthly) with similar retrieval fees — making Nearline cheaper for capacity but Azure competitive once data transfer patterns, read requests, and write requests are factored in. Running both scenarios through a free cloud storage cost calculator side by side is the only reliable way to compare pricing for your specific inputs and to estimate cloud costs easily.
How are data transfer costs calculated?
Egress fees apply to transfer out from the provider to the internet or across regions. Most major providers charge on a tiered basis — AWS, for example, charges $0.09 per GB for the first 10 TB of egress each billing cycle from us-east-1, with the rate decreasing at higher volumes. Cross-region transfers incur inter-region fees, while transfers within the same region to other services in the same availability zone are typically free. Internet transfer costs are billed separately from retrieval fees, so archival workloads may incur both. Inbound transfers (uploads) are free on all major platforms.
Are free tiers included in estimates?
Most provider-specific calculators — including the Google Cloud pricing calculator — do not subtract free tier allocations from estimates by default, since free tier eligibility depends on your account age, existing usage across products, and whether your account has already consumed its free allocation. AWS offers 5 GB of S3 Standard capacity free each month for new accounts; Google Cloud provides 5 GB of regional capacity free monthly. If you are a new user, factor these free tier amounts out of your figures manually. After your first 12 months, free tier benefits typically expire and your full projected figure becomes your actual monthly cost baseline.
How often is pricing data updated?
Providers update their pricing infrequently for stable services — major price reductions happen once or twice per year on average — but regional price variations, new tier introductions, and changes to API operations rates can occur more often. Provider-specific calculators like the AWS Pricing Calculator and Google Cloud pricing calculator are updated by the providers themselves and reflect current list pricing. Third-party multi-cloud calculators and open-source tools rely on community maintenance and may lag by days to weeks after a provider announcement. Regular updates and maintenance of your estimation inputs — particularly after a provider publishes new pricing information — are essential for keeping your forecasts aligned with actual billing account pricing. Always verify with official documentation before committing to a budget based on estimated figures. Sales teams at each provider can also confirm whether negotiated rates or custom agreements apply to your account.
Lifecycle Policies, Reserved Capacity and Egress Reduction Tips
- Lifecycle policies: Automate tier transitions — move objects from Hot to Cool after 30 days of no access, then to Archive after 90 days. This alone can reduce storage costs by 70–90% for backup repositories.
- Egress avoidance: Same-region data transfers between services are free on all three platforms. Process data in-region (Lambda, Azure Functions, Cloud Run) instead of downloading it for local processing.
- Minimum storage durations: Archive tiers charge for the minimum duration even if data is deleted early. Avoid storing short-lived objects in deep archive tiers.
- Retrieval fees: Archive tiers charge per-GB retrieval fees that are not included in this calculator's base storage cost. Add $0.002–$0.05/GB to restore cost estimates for archive-tier data.
- Reserved capacity: AWS S3 and Azure offer discounts for committed storage reservations (1 or 3 years). For stable, predictable workloads, reserved pricing can reduce storage costs by 20–40%.
Cloud Storage Cost Calculator: Frequently Asked Questions
3 questions Quick answers about the Cloud Storage Cost Calculator and how its results are calculated.
-
How much does AWS S3 storage cost per month?
AWS S3 Standard costs approximately $0.023/GB/month ($23/TB/month). S3 Standard-IA costs $0.0125/GB/month. S3 Glacier Instant Retrieval costs $0.004/GB/month. S3 Glacier Deep Archive costs $0.00099/GB/month. Prices vary by region.
-
Is Azure Blob Storage cheaper than AWS S3?
Azure Blob Hot tier ($0.018/GB/month) is slightly cheaper than AWS S3 Standard ($0.023/GB/month) for pure storage. However, total cost depends on request volume, egress, redundancy options, and access patterns. Archive tiers are comparable at ~$0.001/GB/month.
-
What are cloud storage egress fees?
Cloud egress fees are charged when data leaves a cloud provider's network. AWS charges $0.09/GB (first 10 TB/month), Azure $0.087/GB, and GCS $0.08/GB for outbound internet traffic. Same-region and same-zone transfers are typically free or minimal cost.