

RAID Price Per TB Calculator
The RAID Price Per TB Calculator gives you the true cost of usable storage after RAID overhead has eaten into your raw capacity. Enter your Number of Drives, Drive Capacity, Price Per Drive, and RAID Level to see your usable capacity and true cost per usable TB — the only figure that matters when comparing drive configurations. Also see: Data Transfer Time Calculator.
Results
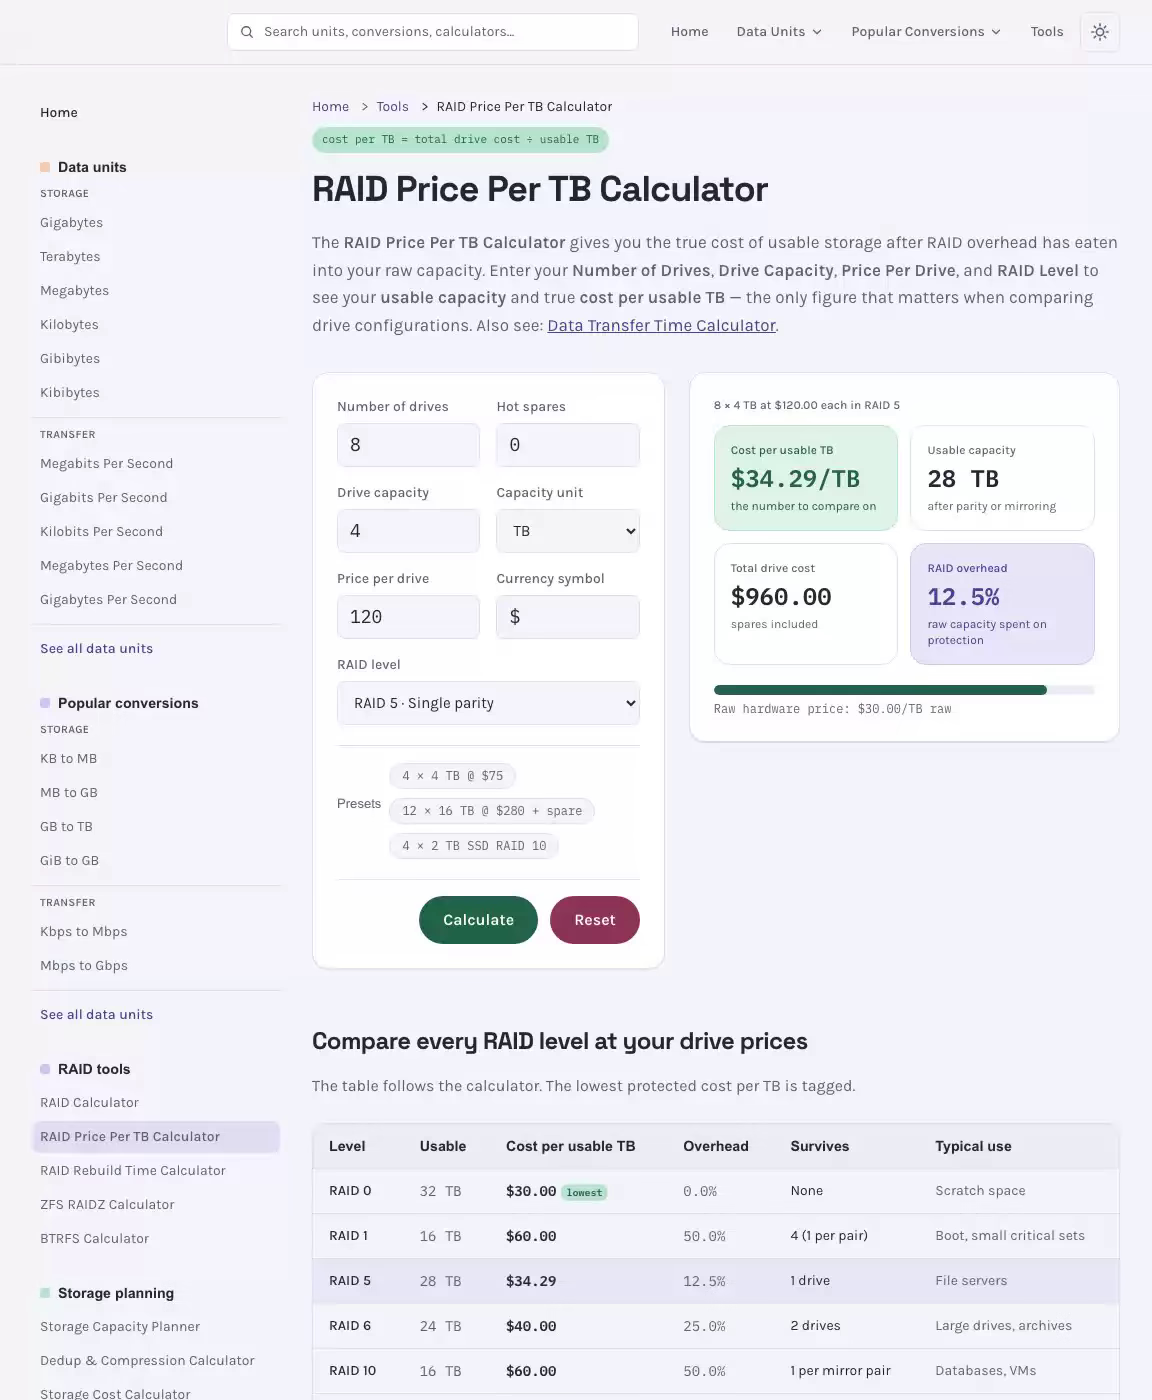
8 × 4 TB at $120.00 each in RAID 5
Cost per usable TB
the number to compare on
Usable capacity
after parity or mirroring
Total drive cost
spares included
RAID overhead
raw capacity spent on protection
Raw hardware price:
Compare every RAID level at your drive prices
The table follows the calculator. The lowest protected cost per TB is tagged.
| Level | Usable | Cost per usable TB | Overhead | Survives | Typical use |
|---|---|---|---|---|---|
| RAID 0 | 32 TB | $30.00lowest | 0.0% | None | Scratch space |
| RAID 1 | 16 TB | $60.00 | 50.0% | 4 (1 per pair) | Boot, small critical sets |
| RAID 5 | 28 TB | $34.29 | 12.5% | 1 drive | File servers |
| RAID 6 | 24 TB | $40.00 | 25.0% | 2 drives | Large drives, archives |
| RAID 10 | 16 TB | $60.00 | 50.0% | 1 per mirror pair | Databases, VMs |
| RAID 50 | 24 TB | $40.00 | 25.0% | 1 per group | Capacity with speed |
| RAID 60 | 16 TB | $60.00 | 50.0% | 2 per group | Maximum resilience |
How Redundancy and Parity Multiply Your Storage Budget
Planning a new RAID Price Per TB Calculator setup means more than just picking a RAID level — it means knowing exactly what your usable storage costs per terabyte before you spend a dollar on disk units. Whether you're building a homelab NAS, architecting enterprise storage, or sizing out a surveillance video storage array, the price-per-TB metric is the single most powerful number for comparing setups side by side and making confident purchasing decisions. Use this raid performance calculator to estimate storage costs and plan your disk array with confidence, ensuring data protection and scalability from the start.
See the RAID Price Per TB Calculator in Action
Configure Your Disk Units and RAID Setup Using the RAID Price Per TB Calculator
The interactive tool above functions as a full-featured RAID capacity calculator and performance estimator in one. To get accurate results, you'll want to provide the following inputs: Related: BTRFS Calculator.
- Disk Size: Enter the size of each individual unit in terabytes. All units in a standard RAID setup must be the same size; if you plan to use different-sized disks, consider a Synology Hybrid RAID (Synology's SHR format) to minimize wasted space.
- Per-Unit Cost: The purchase price of one disk (in dollars). This is used to compute your aggregate storage expense and the resulting cost per TB of usable space.
- Drive Type (HDD or SSD): Selecting HDD or SSD affects both the performance benchmarks displayed and your cost analysis, since SSD price per TB remains significantly higher than HDD price per TB for most storage volumes.
- Type / RPM: For spinning disks, select the RPM tier — 5400 RPM, 7200 RPM, 10K RPM, or 15K RPM — or select SSD. This determines the baseline IOPS (IO/s) and transfer rate (MB/s) values used in the performance estimate.
- RAID Type: Choose from RAID 0, RAID 1, RAID 5, RAID 6, RAID 10, RAID 50, or RAID 60. Each level determines the usable space formula, fault tolerance, and IO penalty applied to your performance estimate.
- Disks Per Group: Enter the count of disk units per group. For compound RAID types such as RAID 50 or RAID 60, set this to the count per each RAID 5 or RAID 6 segment.
- Group Count: If your storage system consists of more than one identically sized group, enter the total here. This is required to estimate RAID 50 and RAID 60 correctly — select RAID 5 or RAID 6, respectively, and set the group count to a minimum of 2.
- Read Operations (%): Use the slider to indicate what percentage of your workload is reads versus writes. This percentage directly influences the effective IOPS calculation, since write-intensive workloads on parity RAID types incur an IO penalty.
Once your inputs are set, the results panel displays your key storage planning metrics in real time:
- Total Usable Capacity — the actual gigabytes or terabytes available for keeping data after parity or mirroring overhead is accounted for.
- Reserved Capacity for System — each disk unit in the array must reserve approximately 10 GB of system space for the OS, system partition, swap partition, system data, and temporary data. This set-aside space is not available for creating volumes.
- Available Space — the usable storage remaining after the system space reservation, and before partition overhead. When you create volumes, the system further sets aside space for indexing: partitions using the Btrfs partition format reserve approximately 4% for indexing, while those using the ext4 partition format reserve approximately 2%. As a result, the actual available capacity for keeping data will be slightly less than the estimated figure shown here. This 2% capacity reservation is a key factor in precise planning.
- Price Per TB — your aggregate expense divided by total usable space in terabytes. This is the core cost per terabyte usable metric that allows side-by-side comparison of any two setups or disk options.
- Aggregate Expense — the sum of all disk costs in your setup.
- Transfer Rate (MB/s) — estimated sequential transfer rate based on your selected disk type, RPM, RAID level, and read/write mix.
- IOPS (IO/s) — estimated random IOPS based on 4KB block random workloads, adjusted for the IO penalty of the selected RAID level.
Understanding Disk Size and Per-Unit Cost Inputs
Your disk size selection is the foundation of every calculation. When you enter 4 TB per unit with a per-unit expense of $75, the tool knows to weight each terabyte of raw space at $18.75 before any RAID overhead is applied. The moment you select a RAID level, the overhead is factored in and your effective cost per terabyte rises above the raw disk price — sometimes dramatically.
For example, a RAID 1 mirror cuts your usable storage in half, doubling the cost per TB usable compared to the raw disk price. A six-disk RAID 6 setup sacrifices two disks' worth of space for dual-parity protection, which raises the dollar per TB compared to RAID 5 but provides tolerance against two simultaneous disk losses. Planning your storage budget accurately requires this kind of instant space estimate — which is exactly what this tool delivers.
When selecting disks, keep the product family and condition in mind. A new NAS spinning disk with a 3-year or 5-year warranty from a manufacturer's NAS-optimized lineup (such as Seagate IronWolf or WD Red) will carry a higher disk price per TB than a used or refurbished enterprise unit sourced from a data center decommission. The warranty coverage, endurance rating (DWPD — disk writes per day — and TBW — terabytes written), and the recording technology all affect long-term reliability and should factor into your purchasing decision alongside raw disk prices.
Selecting Your RAID Level and Group Count
When you select a RAID level in this tool, you're choosing the fundamental tradeoff between space efficiency, fault protection, and performance. The group count field matters most for compound setups: a RAID 50 array consists of two or more RAID 5 segments striped together into a single logical unit, while RAID 60 does the same with RAID 6 segments. For a single group — the most common setup for small NAS or server deployments — leave this field set to 1.
If your storage environment consists of multiple identically sized groups (common in enterprise arrays, data center systems, or hyperscale deployments), entering the correct count here ensures your total usable space, aggregate expense, and IOPS figures reflect the full deployment rather than just one group.
How Read Operations (%) Affects RAID Performance
The read operations (%) slider is critical for accurate performance modeling. In a mixed-workload environment — such as a database server running transaction-intensive applications — the effective IOPS for a parity-based level like RAID 5 or RAID 6 is lower than the theoretical maximum because every write operation requires additional read IO from the array to calculate and update parity. This is the write penalty effect.
For RAID 5, each host write IO generates 4 array IO operations (read old data, read old parity, write new data, write new parity) — an IO penalty (write) of 4/1. For RAID 6, the write penalty is even higher at 6/1 due to dual parity. RAID 0 and RAID 10 have no write penalty (IO penalty write = 1/1), which is why they are preferred for write-intensive workloads. Setting your read percentage accurately lets the tool apply the correct effective IOPS formula for your real-world environment.
RAID 0 Striped Set Performance Estimate: A Worked Example
Consider a simple RAID 0 (striped set) built from 2 units × 4 TB HDDs at $75 each, with reads set to 50% and writes to 50%. This example also demonstrates raid0 capacity calculation:
- Identify the disk performance baseline: A 7200 RPM SATA HDD delivers approximately 170 IO/s at 4KB random block size.
- Calculate single group performance (RAID 0, no IO penalty): Total Performance = Single Disk IO/s × Disk Count = 170 × 2 = 340 IO/s
- Calculate total usable space (RAID 0 = sum of all disks): Total Usable Space = 4 TB × 2 = 8.000 TB
- Calculate aggregate expense: Aggregate Expense = $75 × 2 = $150.00
- Calculate price per TB: Price per TB = $150.00 ÷ 8 TB = $18.75 per TB
Result: RAID 0 Striped Set Performance Estimate: Total Performance = 340 IO/s, Total Usable Space = 8.000 TB, Aggregate Expense = $150.00, Price Per TB = $18.75. This illustrates RAID 0's strength — maximum space, maximum transfer rate, lowest cost per TB — and its fatal weakness: fault tolerance = 0. A single disk loss destroys all data. RAID 0 is explicitly not recommended for any data with meaningful business value.
RAID 5 with Four Disks: Balancing Cost Per TB and Fault Tolerance
- Setup: 4 units × 4 TB HDDs at $75 each, RAID 5.
- Usable space formula (RAID 5 = N − 1 disks): Usable Space = (4-1) × 4 TB = 12 TB
- Aggregate expense: Aggregate Expense = $75 × 4 = $300.00
- Price per TB: Price per TB = $300.00 ÷ 12 TB = $25.00
RAID 5 tolerates a single disk loss: if one unit fails, the array continues to operate, and the data can be reconstructed from the distributed parity once a replacement is inserted and a rebuild completes. The tradeoff is a higher cost per TB than RAID 0 ($25.00 vs. $18.75) and a write penalty that reduces effective IOPS in write-heavy workloads. RAID 5 requires a minimum of 3 disks and is widely used in NAS, home server, and small business storage solutions.
RAID 10 with SSDs: Performance-Optimized Storage at a Premium
- Setup: 4 units × 2 TB SSDs at $120 each, RAID 10.
- Usable space formula (RAID 10 = 50% of raw space): Usable Space = (4 × 2 TB) ÷ 2 = 4 TB
- Aggregate expense: Aggregate Expense = $120 × 4 = $480.00
- Price per TB: Price per TB = $480.00 ÷ 4 TB = $120.00
RAID 10 (also written as RAID 1+0) creates striped pairs of mirrored units, delivering the highest random IOPS of any common RAID setup alongside solid fault tolerance — it can survive one disk loss per mirrored pair simultaneously. The SSD price per TB is substantially higher than an equivalent HDD RAID, but the performance boost in random read and write operations (particularly at 4KB block and 64KB block sizes) makes RAID 10 with SSDs the standard choice for response-time-sensitive applications like databases and virtualization hosts. This setup illustrates the core tradeoff the tool surfaces: the highest-performing RAID option carries the highest cost per terabyte usable.
RAID Levels Compared: Capacity, Cost, and Fault Tolerance at a Glance
This raid price per tb calculator supports all major RAID levels used in production environments. The table below summarizes the key parameters for each — use it as a reference when evaluating which setup best matches your storage planning requirements, budget, and fault-protection needs.
| RAID Level | Minimum Disks | Usable Space Formula | Fault Tolerance | Price per TB Impact | Technology |
|---|---|---|---|---|---|
| RAID 0 (Stripe Set) | 1 (practical: 2) | N × Disk Size | None — any disk loss = data loss | Lowest (equals raw disk price per TB) | HDD or SSD |
| RAID 1 (Mirror) | 2 | 1 × Disk Size (regardless of N) | 1 disk (any single disk loss) | Highest for 2-disk setups (2× raw cost per TB) | HDD or SSD |
| RAID 5 | 3 | (N − 1) × Disk Size | 1 disk failure | Moderate; improves as disk count grows | HDD (CMR recommended); SSD |
| RAID 6 | 4 | (N − 2) × Disk Size | 2 simultaneous disk failures | Higher than RAID 5 for same disk count | HDD (CMR); SSD |
| RAID 10 (1+0) | 4 | (N / 2) × Disk Size | 1 disk per mirrored pair | High (50% overhead always) | HDD or SSD |
| RAID 50 (5+0) | 6 | ((N/groups) − 1) × groups × Disk Size | 1 disk per RAID 5 segment | Moderate to low; improves at scale | HDD or SSD |
| RAID 60 (6+0) | 8 | ((N/groups) − 2) × groups × Disk Size | 2 disks per RAID 6 segment | Higher than RAID 50 | HDD or SSD |
How the Calculator Computes Price Per TB
The core formula is straightforward: See also: Storage Throughput Converter.
Where:
Aggregate Expense = Disk Count × Per-Unit Cost Total Usable Space = f(RAID Level, N, Disk Size)For example, RAID 5 with N disks of size S TB each:
And for RAID 6 with N disks and dual parity:
The fault-protection overhead — the space reserved for protection — is the difference between raw space and usable space. For RAID 5 with 4 × 4 TB disks, the protection-reserved space equals 1 × 4 TB = 4 TB, and the net usable storage is 12 TB. The tool makes this reserved space explicit so you can see exactly how much of your raw space goes toward mirroring or parity rather than holding user data.
Reserved Capacity for System vs. Available Capacity
There is an important distinction between total usable capacity (what the disk array presents after parity or mirroring overhead) and available space (what you can actually use for saving data). Every disk unit in an array reserves approximately 10 GB of system space — this space is consumed by the OS installation, system partition, swap partition, system data, and temporary data required for the NAS or server to function. This system reservation is deducted from total usable capacity before partitions can be created.
After accounting for system space, the remaining partition space is further reduced by indexing overhead. In environments using the Btrfs partition format, approximately 4% of the partition space is reserved for indexing. In environments using the ext4 format, approximately 2% is reserved. This means the actual available space for user data is always somewhat less than the estimated figure shown by the tool. For precise figures in a Synology NAS environment, the Synology Storage Manager shows the real available space of each partition after all reservations are applied.
When planning storage space, always factor in this layered reduction. For large arrays, the percentage impact is small — 10 GB per disk out of 4 TB or 16 TB units is negligible. For smaller disks, the system space reservation represents a higher proportion of each unit's total space.
RAID Level and Disk Type: HDD vs. SSD Cost-Per-TB Tradeoffs
The choice between spinning disks and SSDs is the single largest lever on your price per TB. Current market data from disk price tracking sources shows that internal 3.5-inch SATA spinning disks in the 8 TB to 20 TB range can be found at prices ranging from approximately $0.025 to $0.040 per GB (or $25 to $40 per TB raw), while internal SSDs — whether SATA SSD, NVMe SSD, or M.2 NVMe — typically start at $0.08 to $0.15 per GB or higher, representing a 3× to 6× premium over equivalent spinning-disk space at the same point in time. This cost gap is why bulk storage applications — including NAS arrays, archival storage, backup storage, long-term storage, and surveillance video storage — continue to be dominated by spinning disks rather than SSDs.
That said, specific workloads justify the SSD price premium. RAID 10 with enterprise SSDs or NVMe SSDs delivers random read and write performance an order of magnitude beyond what any spinning-disk array can provide. For database servers, virtualization hosts, and other response-time-sensitive applications, the performance boost justifies the storage expense premium. For sequential transfer-rate workloads like video recording, large data movement, and media playback, 7200 RPM spinning-disk arrays can saturate most network connections at a fraction of the cost.
The form factor also matters. A 3.5-inch enterprise spinning disk or NAS unit (such as Seagate IronWolf, WD Red, WD Gold, or WD Purple for surveillance) offers the best price per TB in the spinning disk category. A 2.5-inch SSD (SATA SSD) offers moderate performance at moderate cost, while an M.2 NVMe SSD or PCIe Gen4 NVMe SSD provides maximum performance at the highest price per TB. For your RAID setup, select disks based on the primary workload requirement and the space efficiency you need from the array.
Consider disk endurance carefully for write-intensive RAID environments. SSD endurance is rated in TBW (terabytes written), DWPD (disk writes per day over the warranty period), and sometimes PBW (petabytes written). These SSD useful life ratings vary widely between consumer-grade and enterprise SSD options. A consumer SATA SSD with 360 TBW is not designed for continuous operation in a RAID array that sustains heavy write loads; an enterprise SSD rated for 3 DWPD or higher is appropriate for such environments. The tool does not automatically warn you about endurance mismatches, so always cross-reference the disk's product spec sheet against your expected write workload before finalizing your RAID setup.
Disk Performance Reference Table: IOPS and Transfer Rate by Disk Type
This table provides approximate IOPS and transfer-rate values for common disk types. These figures are used as the baseline single disk performance inputs for the performance estimate. Actual values vary by specific disk model, firmware, and workload — treat these as representative estimates for storage planning. IOPS (IO/s) and transfer rate (MB/s) are the two primary performance measurements for storage devices and RAID sets. IOPS is the standard measurement for random small block (4–8 KB) IO operations typical of transaction-intensive applications and database workloads, while MB/s is used for wide block (64 KB or 512 KB and above) random or sequential operations such as data movement, media playback, and backup workloads.
| Disk (Type / RPM) | IOPS (4KB block, random) | IOPS (64KB block, random) | MB/s (64KB block, random) | IOPS (512KB block, random) | MB/s (512KB block, random) | MB/s (wide block, sequential) |
|---|---|---|---|---|---|---|
| FC / 15K | 163–178 | 151–169 | 9.7–10.8 | 97–123 | 49.7–63.1 | 73.5–127.5 |
| SAS / 15K | 188–203 | 175–192 | 11.2–12.3 | 115–135 | 58.9–68.9 | 91.5–126.3 |
| FC / 10K | 142–151 | 130–143 | 8.3–9.2 | 80–104 | 40.9–53.1 | 58.1–107.2 |
| SAS / 10K | 142–151 | 130–143 | 8.3–9.2 | 80–104 | 40.9–53.1 | 58.1–107.2 |
| SAS/SATA / 7200 | 73–79 | 69–76 | 4.4–4.9 | 47–63 | 24.3–32.1 | 43.4–97.8 |
| SATA / 5400 | 57 | 55 | 3.5 | 44 | 22.6 | ~80–120 |
| SSD (SATA/NVMe) | 50,000–600,000+ | 10,000–200,000+ | 300–7,000+ | 5,000–100,000+ | 400–6,500+ | 500–14,000+ |
The performance table above covers the primary disk types relevant to RAID deployments: FC 15K (Fibre Channel 15,000 RPM) and SAS 15K units are the fastest spinning-disk option, historically used in mission-critical enterprise arrays and storage area networks. FC 10K and SAS 10K units offer a middle tier of performance used in enterprise database and application server environments. SAS/SATA 7200 RPM units — including 7200 RPM NAS disks and enterprise-capacity spinners — form the backbone of most NAS arrays, rack server storage, and data center storage deployments. SATA 5400 RPM units are common in desktop HDDs, consumer NAS, and portable HDDs where power efficiency matters more than raw performance. SSDs span an enormous range depending on interface: a SATA SSD delivers roughly 500 MB/s sequential rate, while a PCIe Gen5 NVMe SSD can exceed 14,000 MB/s.
For your RAID performance estimate, this tool does not perform automatic conversion between IO/s and MB/s. If you switch between IOPS and transfer-rate units in the single disk performance field, remember to update the value accordingly. IOPS measurements apply to random IO/s workloads (most relevant for 4KB block random IO, typical of transaction-intensive applications), while MB/s applies to wide block sequential rates (relevant for data movement, video recording, and media playback workloads).
RAID 5 and RAID 6 Write Penalty: Effect on Effective IOPS
Understanding the IO penalty is essential for accurate performance modeling of parity-based RAID levels. For every host IO write operation, the RAID controller must perform additional underlying disk IOs to maintain parity data. This is the write penalty:
- RAID 5 write penalty: 4 array IO per 1 host IO write (read old data + read old parity + write new data + write new parity). IO penalty (write) = 4/1.
- RAID 6 write penalty (dual parity): 6 array IO per 1 host IO write. IO penalty (write) = 6/1.
- RAID 0 and RAID 1 write penalty: 1/1 — no additional IO overhead on writes.
- RAID 10 write penalty: 2/1 — writes go to both units in each mirrored pair, but no parity calculation is required.
The effective array-wide IOPS is calculated using your read percentage to weight the read-penalty-free path against the write-penalty path:
In simplified terms: at 100% reads, the write penalty has no effect and you get the full combined transfer rate of all disks. At 100% writes on a RAID 5 array with 4 disks, each write consumes 4 array IOs, significantly reducing the host-visible IOPS compared to the raw disk total. This is why write-intensive applications should consider RAID 10 over RAID 5 or RAID 6, even though RAID 10 carries a higher price per TB usable.
Understanding RAID Performance at Different Block Sizes
Disk performance varies significantly based on the IO block size of the workload. The performance reference table above includes values for 4KB block random IO, 64KB block random IO, and 512KB block random IO. Here is why each matters:
- 4KB block random IOPS: The primary benchmark for database and transaction-heavy workloads. Spinning disks are limited to 50–200 random IOPS due to rotational response time and seek delay. SSDs deliver tens of thousands to hundreds of thousands of random IOPS at this block size, which is why SSD RAID is often specified for transactional database environments. This also illustrates why random write performance matters so much when selecting a RAID level.
- 64KB block random IOPS and MB/s: Intermediate workloads such as virtual machine disk images, mixed file access, and some backup applications. Spinning disk performance at this block size is higher in MB/s than at 4KB but still constrained by rotation.
- 512KB block random / sequential rate: Streaming media, video recording, large sequential data movement, and backup workloads. Both spinning disks and SSDs perform closer to their sequential read and write speed limits at this block size. A modern 7200 RPM SATA disk can achieve 150–250 MB/s sequential rate, while enterprise SSDs can sustain multiple GB/s.
Your choice of block size for modeling should match your dominant workload type. Transaction-heavy applications work at the 4KB block level, so random IOPS is the relevant metric. Video surveillance, NAS file sharing, and media server workloads are better modeled using sequential rate in MB/s.
Recommended Disk Selection: Form Factor, Condition, and Warranty
When sourcing disks for your RAID setup, the following guidelines help you select compatible, reliable storage units:
| Use Case | Disk Category | Form Factor | Condition | Warranty | Affiliate Link |
|---|---|---|---|---|---|
| Home NAS, Media Server | NAS Spinning Disk (WD Red, Seagate IronWolf) | 3.5 inch | New | 3 year warranty | See current disk prices |
| Enterprise NAS, Server | Enterprise HDD (Seagate Exos, WD Gold) | 3.5 inch | New or Renewed | 5 year warranty | See current disk prices |
| Surveillance, DVR/NVR | Surveillance HDD (WD Purple, Seagate SkyHawk) | 3.5 inch | New | 3 year warranty | See current disk prices |
| High-Performance DB / VM | Enterprise SSD (SATA SSD or NVMe SSD) | 2.5 inch or M.2 | New | 5 year warranty | See current disk prices |
| Budget Build / Archive | Desktop HDD (Used / Refurbished) | 3.5 inch | Used or Refurbished | 1–2 year warranty | See current disk prices |
| SAS Server Arrays | SAS 15K or SAS 10K | 2.5 inch SFF | New or Used | 1 year warranty | See current disk prices |
Disk prices on Amazon and other retailers are subject to change frequently — the price and availability information displayed at the time of purchase applies to the actual transaction. Always verify current pricing before committing to a disk count and setup. As an Amazon Associate, links to disk products earn from qualifying purchases at no additional cost to you.
When buying disks for a RAID array, always check the unit's compatibility with your NAS enclosure or server. Synology publishes a Products Compatibility List that identifies which disks are compatible with each NAS model; Western Digital, Seagate, and other manufacturers publish similar compatibility lists for their NAS arrays, rack servers, and tower servers. Some NAS models may not support disks of certain sizes as individual partitions, but the total space can still be achieved through other disk combinations or by pairing with expansion units. Always refer to the device spec sheet to understand the software specifications and maximum partition size supported by each model, including which RAID levels are available and what the maximum space of a single partition is on that platform.
How the RAID Capacity Estimate Calculator Works
This tool computes instant space estimates and cost-per-TB figures based on your inputs, without requiring you to manually apply the usable space formula for each RAID level. Internally, the calculator:
- Takes your disk size, disk count, and selected RAID level to determine total raw space.
- Applies the appropriate space math — subtracting parity disks for RAID 5 and RAID 6, halving for RAID 1 and RAID 10, or using the full space for RAID 0 — to compute total usable space.
- Subtracts system space (approximately 10 GB per disk) to compute the partition space available for use.
- Multiplies your per-unit cost by the total disk count to get your aggregate storage expense.
- Divides aggregate expense by total usable space to produce the price per TB metric.
- Applies disk performance benchmarks for your selected disk type and RPM tier to compute estimated single disk performance, then scales by disk count and array IO penalty at your specified read percentage to produce IOPS (IO/s) and transfer-rate (MB/s) estimates.
For compound RAID setups (RAID 50, RAID 60), the tool treats each RAID 5 or RAID 6 segment independently, then aggregates results across the group count to compute total performance, total usable space, and aggregate expense. The minimum disk count for a RAID 50 group (two RAID 5 segments) is 6; for RAID 60 (two RAID 6 segments) is 8. If you specify too few disks for the selected RAID level, the tool will indicate an invalid setup condition.
RAID Types Overview: Choosing the Ideal Setup for Your Workload
Each RAID level serves a different balance of requirements. Here is a concise guide to help you select disks and configure your ideal setup. Understanding the different raid models available helps you match the right level to your workload:
- RAID 0: Maximum storage space and maximum transfer rate. Zero fault protection — not suitable for any data you cannot afford to lose. Best for temporary scratch space, render caches, or systems where data is already protected elsewhere.
- RAID 1: Complete mirroring of all data onto two units. 50% space efficiency. Excellent for OS partitions, boot disks, and small critical datasets where simplicity and immediate fault tolerance matter most.
- RAID 5: Single-disk fault tolerance with reasonable space efficiency. The most common RAID setup for NAS arrays, home servers, and small business storage. Write penalty reduces effective IOPS in write-heavy applications. Requires dependable rebuilds — CMR disks are strongly recommended over SMR disks for RAID 5, as SMR units can experience extremely long rebuild times due to their recording technology.
- RAID 6: Dual-parity data protection — the array survives two disk losses simultaneously. Essential for large arrays where the probability of a second disk loss during an array rebuild is non-negligible. Carries a higher write penalty than RAID 5 (6/1 vs. 4/1) and a higher price per TB for the same disk count.
- RAID 10: Combines data striping and data mirroring. Speed plus fault protection — the best performance and tolerance combination for write-intensive workloads. 50% space overhead regardless of disk count. Minimum four disks. Preferred for databases, virtualization, and high-IOPS applications.
- RAID 50 and RAID 60: Compound RAID setups that stripe across multiple RAID 5 or RAID 6 segments, delivering a performance boost from striping while retaining the fault tolerance of parity RAID. Used in larger enterprise arrays and data center deployments where both high transfer rates and fault protection are required. Requires careful planning of the disks per group and group count to optimize the balance of efficiency and performance.
If you plan to expand your array over time, consider how each RAID level handles adding disks. Standard RAID setups typically require you to add disks in specific increments — for example, adding a full set to create an additional group rather than inserting one disk at a time. Synology NAS devices support online RAID expansion and migration in many setups, allowing you to grow storage space without downtime; consult the Synology Storage Manager and your product's spec sheet for the specific expansion capabilities supported by your model.
ZFS RAIDZ, TrueNAS, and Alternative RAID Implementations
Beyond hardware and software RAID set up via traditional RAID levels, several alternative implementations are worth understanding in the context of storage planning:
- ZFS RAIDZ: The ZFS storage system includes its own RAIDZ variants (RAIDZ1, RAIDZ2, RAIDZ3) that function similarly to RAID 5, RAID 6, and triple-parity RAID but are implemented at the storage-system level rather than the block device level. ZFS RAIDZ avoids the RAID 5 write hole vulnerability and handles indexing and data checksumming natively. TrueNAS (formerly FreeNAS) and other open-source NAS platforms use ZFS RAIDZ as their primary storage fault-protection mechanism. The space formulas are similar to their hardware RAID equivalents.
- Synology Hybrid RAID (SHR): A proprietary RAID implementation from Synology designed to maximize usable space from disk combinations of varying sizes. SHR provides single-disk fault tolerance (like RAID 5), while its two-drive-fault-tolerant SHR-2 variant provides dual-disk fault tolerance (like RAID 6). The Synology RAID Calculator specifically accounts for SHR and SHR-2 space math, which differs from standard RAID formulas when disks of varying sizes are used.
- JBOD (Just a Bunch of Disks): JBOD pools do not offer any data protection. The available space of a JBOD storage pool equals the combined space of all disks, and JBOD supports mixing disk sizes. It is the simplest and highest-space-efficiency option but provides zero protection against disk loss — any single disk failure results in loss of the data on that unit.
- JBOF (Just a Bunch of Flash): An all-flash equivalent of JBOD used in modern all-flash arrays and NVMe-based storage infrastructure.
Capacity Planning, Disk Count, and Buying Disks
Effective storage planning means knowing your current requirements and leaving room for growth. When using this tool to plan storage, consider the following factors alongside the price-per-TB output:
- Disk count and minimum disks: Every RAID level has a minimum disk count. Buying too few units means you cannot implement your desired RAID setup at all. Plan for the right disk quantity from the start to avoid having to perform a RAID migration later.
- Uniform disk sizes: Standard RAID implementations work best with disks of the same size and ideally the same model. Mixed disk sizes on non-SHR arrays result in wasted space — the array is limited to the smallest disk's size for each unit's contribution to the partition.
- Disk endurance and continuous operation: NAS spinning disks and enterprise units are rated for 24/7 operation. Desktop HDDs and portable HDDs are typically rated for lighter duty cycles. For RAID arrays that run continuously in surveillance systems, media servers, and file servers — use NAS-grade or enterprise-grade disks to ensure reliable endurance and minimize the risk of premature disk loss.
- RAID support in your hardware: Not all NAS enclosures, rack servers, and storage systems support every RAID level. Confirm your hardware's RAID support before purchasing disks. Some NAS models have a maximum partition size limit that may be lower than the total array space; check the software specifications in your product's spec sheet to understand the actual space support for partitions on your specific platform.
- Fault-protection rule for large arrays: As disk count increases and individual disk sizes grow (to 16 TB, 20 TB, or beyond), the risk of a second disk loss during an array rebuild window increases. For arrays with 8 or more large-capacity disks, RAID 6 or RAID 60 is recommended over RAID 5 to ensure dual-parity data protection against simultaneous losses during the rebuild operation.
Use this RAID price per TB calculator to run scenario comparisons before buying disks. Try the same total raw space across different RAID setups to see how cost per TB usable changes. Compare two setups side by side — for example, RAID 5 with six 8 TB units versus RAID 6 with eight 6 TB units — to find the setup that delivers the best balance of efficiency, data protection, and performance for your specific storage environment. The tool provides instant space estimates and cost analysis that would otherwise require manual spreadsheet work to compute for every disk combination you want to evaluate.
Whether you're selecting compatible disks for a Synology NAS, planning a homelab file server, sizing a rack server for enterprise storage, building out a data center disk array, or simply comparing disk prices to find the cheapest storage option per usable terabyte, this interactive tool gives you the numbers you need to make the right decision with full scalability in mind.
RAID Price Per TB: Frequently Asked Questions
3 questions Quick answers about RAID price per usable TB and how overhead changes the cost.
-
How is cost per usable TB calculated?
Total drive cost (drives × price each) is divided by the usable capacity after RAID overhead. For 8 × 4 TB drives at $100/drive under RAID 5: total cost = $800, usable = 7 × 4 TB = 28 TB, so cost per usable TB = $800 ÷ 28 = $28.57/TB.
-
Which RAID level is cheapest per usable TB?
RAID 0 is always cheapest because it uses 100% of raw capacity, but provides no fault tolerance. Among protected configurations, RAID 5 and RAID 6 with many drives achieve the best cost efficiency — overhead drops as you add more drives (e.g., RAID 6 on 12 drives is only 16.7% overhead).
-
Does this include the hot spare cost?
Yes. Hot spare drives are purchased and their cost is included in the total. However, they contribute no usable capacity until a failure triggers a rebuild — so they increase cost per usable TB directly proportional to their count.
Price Assumptions, Capacity Estimation and Overhead Notes
- Calculations are based on nominal drive capacity. Actual formatted capacity is typically 5–8% lower depending on the vendor.
- Hot spare drives add to total cost but provide no usable capacity. Their cost is included in the per-TB figure.
- RAID 5 with drives 4 TB or larger carries elevated rebuild risk. RAID 6 or RAID 10 is recommended for large drives in production.
- This calculator covers hardware cost only. RAID controller, enclosure, power, cooling, and maintenance costs are not included.