

Storage Capacity Planner
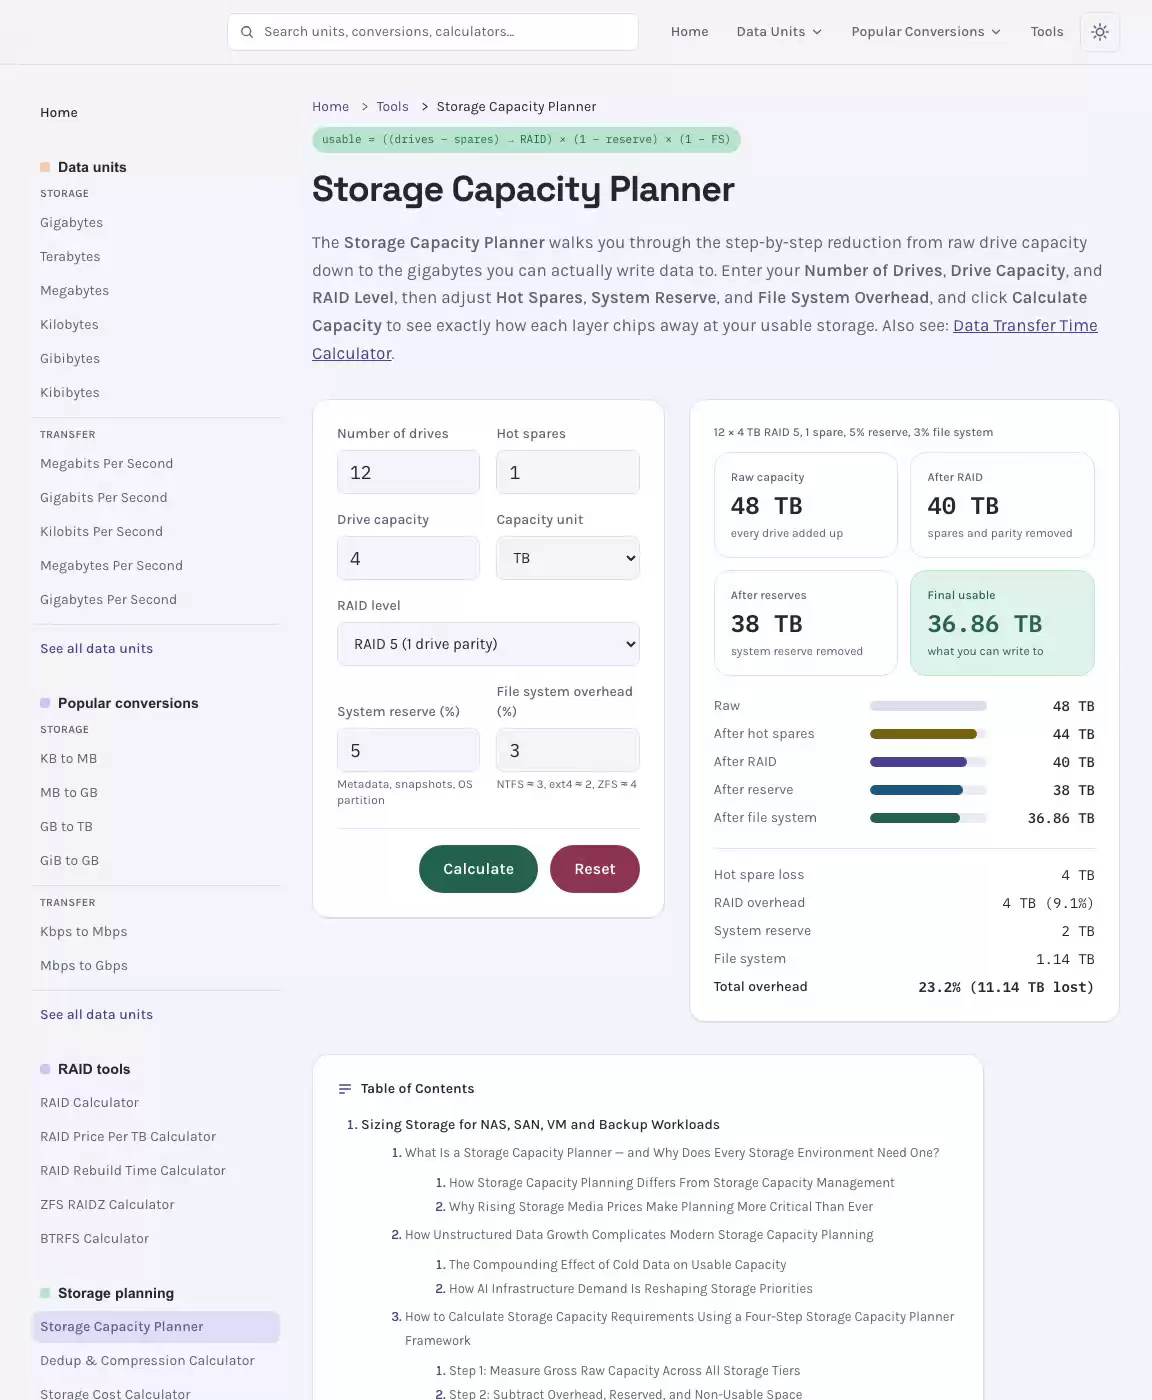
The Storage Capacity Planner walks you through the step-by-step reduction from raw drive capacity down to the gigabytes you can actually write data to. Enter your Number of Drives, Drive Capacity, and RAID Level, then adjust Hot Spares, System Reserve, and File System Overhead, and click Calculate Capacity to see exactly how each layer chips away at your usable storage. Also see: IOPS Calculator.
Results
12 × 4 TB RAID 5, 1 spare, 5% reserve, 3% file system
Raw capacity
every drive added up
After RAID
spares and parity removed
After reserves
system reserve removed
Final usable
what you can write to
- Raw
- After hot spares
- After RAID
- After reserve
- After file system
- Hot spare loss
- RAID overhead
- System reserve
- File system
- Total overhead
Sizing Storage for NAS, SAN, VM and Backup Workloads
Whether you manage terabytes of enterprise NAS or thousands of pallet positions in a distribution center, a reliable storage capacity planner gives you the clarity to make data-driven decisions before you hit a wall. Capacity shortfalls rarely announce themselves in advance — they surface as emergency purchasing calls, unplanned downtime, or last-minute lease growth decisions. This guide walks you through every methodology, metric, and worked example you need to plan ahead with confidence, forecast capacity needs accurately, and stretch your existing storage investment as far as it will go.
See the Storage Capacity Planner in Action
What Is a Storage Capacity Planner — and Why Does Every Storage Environment Need One?
Capacity planning is the ongoing discipline of estimating the space, hardware, software, and connection resources your organization will require over a defined period. In the enterprise context, the core concern is always the same: will there be enough storage infrastructure in place to handle an accelerating number of users, apps, and data creation events? The purpose is not simply to accumulate headroom — it is to match resource availability to forecasted need in the most cost-efficient manner, achieving maximum data management cost savings without leaving expensive capacity idle.
True storage capacity planning means being able to look into the future and estimate system resource needs before the crisis hits. That requires understanding not just how much space you have today, but how different workloads, departments, and data types are consuming it — and how fast that picture is changing. Without this forward-looking view, teams default to reactive purchasing that inflates costs and accelerates refresh cycles unnecessarily.
How Storage Capacity Planning Differs From Storage Capacity Management
Storage capacity planning is forward-looking: it forecasts future needs, models growth trajectories, and informs purchasing and architecture decisions months or years in advance. Storage capacity management, by contrast, is the day-to-day operational practice of monitoring current utilization, identifying waste, resolving issues, and adjusting resources to keep consumption within planned bounds. The two are complementary, not interchangeable. Effective planning creates the baseline and the forecast; effective management executes the policies and maintains the plan over time. A capable storage resource management tool should support both functions simultaneously — providing continuous visibility and automated policy enforcement so that planning decisions translate directly into management actions.
Why Rising Storage Media Prices Make Planning More Critical Than Ever
Rising storage media prices — particularly for flash storage and high-performance NVMe systems — have fundamentally raised the stakes for accurate capacity planning. Enterprise SSD prices increased 53–58% quarter-over-quarter in Q1 2026, according to market tracking data. When each petabyte of primary flash costs significantly more than it did twelve months ago, the cost of over-provisioning climbs proportionally. Enterprises that lack visibility into data growth patterns tend to over-provision expensive storage — or worse, accelerate refresh cycles unnecessarily — while cold, inactive data quietly consumes the premium capacity that active workloads actually need. The combination of escalating flash prices and exploding data volumes is creating a capacity planning crisis across enterprise IT, making a disciplined, analytics-driven approach to planning non-negotiable.
How Unstructured Data Growth Complicates Modern Storage Capacity Planning
Traditional capacity planning assumed relatively predictable growth driven by structured database scale-out and known application requirements. That model no longer reflects reality. Unstructured data — documents, images, video, media files, medical imaging, sensor data, genomics datasets, imaging archives, and research files — now represents 80–90% of all enterprise data according to Gartner. It is growing at annual rates of 55–65% annually, and IDC projects that unstructured data volumes will undergo data tripling between 2023 to 2026. The pace alone would be manageable if the data were predictably distributed — but it is not. Different departments, projects, and workloads generate data at wildly different rates, and a single AI initiative or research project can consume petabytes of capacity within months.
The Compounding Effect of Cold Data on Usable Capacity
The deeper problem is not simply data volume — it is data temperature. Industry research consistently shows that 60–70% of enterprise unstructured data has not been accessed in over 90 days inactive, yet it occupies the same expensive primary storage as actively used files. This cold data accumulation is silent and self-compounding: as new data arrives, cold unstructured data continues to hold its position on high-performance tiers because no automated policy has moved it. Without file-level analytics that reveal file age, data age, data owner, and access patterns, administrators cannot distinguish a fast-growing AI project dataset from a department archive that a departed employee last touched in 2022. The result is storage waste at scale — and capacity waste that compounds every time a new refresh is triggered to accommodate data that should have been moved to lower-cost tiers years ago.
How AI Infrastructure Demand Is Reshaping Storage Priorities
Two converging pressures in 2025 and 2026 are reshaping capacity planning priorities across enterprise systems. First, AI workloads — including AI training data pipelines, AI inferencing jobs, and RAG pipelines — require fast, always-accessible storage for active datasets. When 60–70% of primary storage is occupied by cold data, AI teams compete directly with inactive files for the same premium storage capacity. This drives up the cost of AI infrastructure because teams must purchase more high-performance storage than their active workloads actually require. Second, rising flash and SSD prices mean that every unnecessarily occupied terabyte of primary storage now carries a higher opportunity cost than ever before. AI readiness demands that your storage capacity planner distinguish between data that belongs on premium tiers and cold files that should be moved immediately.
How to Calculate Storage Capacity Requirements Using a Four-Step Storage Capacity Planner Framework
Calculating your true capacity requirements — whether for a warehouse operation or a server environment — follows the same four-step methodology. The goal is to move from gross volume to effective usable capacity, then compare that against workload demand to size your environment correctly. Presenting calculation steps as a clear sequence eliminates the guesswork that plagues complex spreadsheets and manual tracking. Related: Storage Cost Calculator.
Step 1: Measure Gross Raw Capacity Across All Storage Tiers
Begin by cataloguing every asset in your environment. For IT systems, this means inventorying all storage arrays, NAS volumes, server volumes, LUNs, storage pools, CIFS shares, block storage devices, file storage systems, and hosted object buckets. For a physical warehouse, calculate gross volume by multiplying total square footage by clear height — measured from the floor to the lowest obstruction, typically sprinkler heads or lighting fixtures. A facility of 50,000 sq ft with a 30 ft clear height yields 1,500,000 cubic feet of gross volume. In data center terms, gross raw capacity is the sum of all physical drive capacity before any formatting, RAID configuration, or reservation overhead is applied.
Step 2: Subtract Overhead, Reserved, and Non-Usable Space
Raw numbers are misleading without deducting non-productive space. In a data management environment, you must subtract RAID parity overhead, snapshot reserves, replication buffers, filesystem metadata, and any capacity reserved for system functions. In a warehouse, you deduct aisle area, staging zones, dock doors, office space, and any other space that cannot hold product. In a selective rack warehouse, aisles alone consume 40–50% of floor area. In an enterprise NAS environment, RAID and snapshot overhead can consume 20–30% of raw capacity depending on the protection level and snapshot schedule. This subtraction reveals your true usable volume — the space that is actually available for productive use.
Step 3: Apply a Utilization Factor to Determine Effective Capacity
No deployment should be filled to 100% of its usable capacity. Running at full utilization causes performance degradation in data systems and makes restocking impossible in warehouse settings. Apply a realistic vertical utilization factor based on your storage type: selective racking typically achieves 75% of available height, drive-in racking reaches around 70%, and pallet flow systems reach up to 80%. For enterprise data environments, a utilization factor of 70–80% is a widely accepted benchmark that preserves performance headroom and leaves room for unexpected growth spikes. The result of this step is your effective capacity — the number against which you should actually plan.
Step 4: Divide Workload Demand by Effective Capacity to Size Requirements
The final step is matching demand to supply. Divide your projected workload demand — accounting for data growth rate, new application onboarding, and compliance-driven retention requirements — by your effective capacity. If demand exceeds effective capacity within your planning horizon, you have three levers: purchase more resources, reclaim stranded capacity, or tier cold data to lower-cost environments. This step transforms raw utilization numbers into actionable insight that drives real purchasing and architecture decisions.
What Is a Healthy Storage Utilization Rate?
For IT data systems, a storage utilization rate of 70–80% of usable capacity is generally considered healthy. When usage consistently exceeds 80–85%, performance degradation risks increase and unplanned purchases become likely. For warehouse cubic utilization, the healthy range depends on your rack configuration: 70–85% cubic utilization is considered good for selective racking, while denser systems like drive-in configurations can target 80–95% achievable. Below 55% typically signals significant unused vertical space or oversized aisles. Monitoring growth trends against these benchmarks — rather than waiting for alarms — is what separates proactive resource management from reactive firefighting.
Worked Example: Mid-Market Enterprise Calculating Effective Usable Capacity
Consider a mid-market enterprise with 500 TB of raw capacity spread across a mixed NAS and SAN environment. Here is how the four-step framework applies:
- Gross raw capacity: 500 TB across all storage arrays, NAS volumes, and SAN LUNs.
- Subtract overhead: RAID-6 parity consumes approximately 20% (100 TB), snapshots reserve another 10% (50 TB), and replication buffers consume 5% (25 TB). Total overhead: 175 TB. Remaining usable capacity: 325 TB.
- Apply utilization factor: At a 75% utilization factor (the safe operational ceiling for this mixed environment), effective capacity = 325 TB × 0.75 = 244 TB.
- Compare to workload demand: Current active workload data footprint is 200 TB, growing at 18 TB per quarter. Effective capacity of 244 TB will be exhausted in approximately 2.4 quarters — less than 8 months — without intervention.
This analysis — producible in minutes with a capable storage capacity planning tool — gives the IT team a concrete decision window and the data to justify either a tiering initiative or a purchasing conversation.
Track Storage Consumption in Real Time and Generate Capacity Trend Reports
Knowing your current utilization snapshot is useful. Knowing how that utilization is changing over time — and being able to project when capacity will be exhausted — is what enables genuine capacity forecasting. A dedicated resource monitor or monitoring tool collects capacity data, helps you track storage consumption, and surfaces the growth trends and capacity trend reports that transform static metrics into forward-looking plans. The alternative — building complex spreadsheets from data exported from separate storage vendors — is slow, error-prone, and invariably out of date by the time stakeholders review it.
Consistent Performance Visibility Across Heterogeneous Platforms
End-to-end performance visibility across your entire environment is the foundation of effective data management. Modern enterprise settings span on-premises NAS, SAN (storage area network), block device arrays, object repositories, hybrid cloud configurations, and hosted buckets — often from multiple vendors including NetApp, Dell EMC, and HPE. Achieving consistent views across all these systems without deploying a separate monitoring instance for each vendor is a prerequisite for meaningful resource planning. A unified monitoring tool — sometimes called a storage resource monitor — collects real-time performance data from server volumes, NAS volumes, LUNs, shared pools, CIFS shares, and cloud buckets in a single view, eliminating the siloed visibility gaps that make planning decisions unreliable.
This cross-platform visibility also enables effective SAN performance monitoring and NAS performance monitoring simultaneously — so a disk bottleneck in one tier does not go undetected while the team is focused on another platform. Virtualization layers and virtual machines (VMs) add another dimension: a comprehensive resource planning tool should map the dynamic relationships from apps and VMs down through LUNs and shared pools to physical arrays, enabling root cause identification when performance problems surface.
Time-to-Full Forecasts and Automated Alerts for Downtime Prevention
Time-to-full forecasting projects when a specific pool, NAS volume, or array will exhaust its available capacity based on observed growth rates. Rather than waiting for a threshold alert to fire at 85% utilization, a purpose-built software platform computes time-to-full continuously — giving teams weeks or months of lead time to take proactive measures and achieve downtime prevention. Automated alerts tied to growth rate thresholds, rather than static utilization percentages, are far more useful: a volume growing at 5 TB per day requires a different response timeline than one growing at 50 GB per month, even if both are at the same current utilization percentage. Predictive analytics embedded in a capable planning tool should also surface issues before they become performance problems, enabling teams to troubleshoot conditions proactively and prioritize issues by urgency.
Chargeback and Showback Analytics for Storage Accountability
One of the most underused capabilities in enterprise resource management is chargeback and showback reporting. Showback analysis gives business unit leaders and finance stakeholders a clear view of how much space each department consumes and what that consumption costs — without necessarily billing them directly. Storage chargeback goes a step further by allocating actual costs to consuming departments, creating a financial incentive to manage data lifecycle responsibly. Both mechanisms require department-level visibility into usage that vendor-native tools rarely provide across heterogeneous environments. When leaders can show executive stakeholders exactly which departments are driving growth — and at what cost per terabyte — resource allocation decisions move from IT conversations to business conversations. This is where capacity insights become drivers of real organizational change. Business-level data management analysis at this level also supports data governance and compliance obligations by ensuring that consumption is visible, auditable, and tied to accountable owners.
Smarter Capacity Planning Through Data Tiering and What-If Scenario Modeling
The most powerful lever available to any storage capacity planner is not purchasing more storage — it is using the resources you already have more intelligently. Data tiering and what-if scenario modeling together enable IT teams to defer capital expenditure, extend the life of existing systems, and make resource allocation decisions based on quantified projections rather than gut feel. This is where a storage capacity planning tool moves from being a reporting dashboard to being a genuine resource discipline platform. See also: SSD Endurance Calculator.
Right-Sizing Storage Media Across Hot, Warm, and Cold Tiers
Not all data deserves the same tier. Active workloads, structured jobs, AI training datasets, and database storage require the low latency and high throughput of primary flash or NVMe. Warm data — files accessed occasionally but not daily — can live on hybrid or spinning-disk tiers without impacting service level agreement commitments. Cold data — the 60–70% of enterprise unstructured data untouched for 90 days or more — belongs in hosted object repositories, secondary storage, or on-premises archive tiers where the cost per terabyte is a fraction of primary flash. Intelligent tiering — sometimes called transparent data tiering — moves cold data automatically based on metadata criteria including file type, file age, file size, data owner, and custom tags, while preserving transparent file access for end users through dynamic links and file gateway mechanisms. Users continue accessing data from their original file paths with no awareness that the data has moved — enabling non-disruptive capacity reclamation at scale.
Consider a concrete example: an organization discovers through file-level analytics and metadata analytics that 40% of its primary resources are occupied by cold data older than 90 days — cold files including media files, research outputs, imaging archives, and project data that have not been accessed since creation. Rather than purchasing additional flash arrays, the team tiers that data to a cloud object repository using an agent-free, no agents required platform that stores files in their native format on open-standards object storage with no rehydration penalty and no vendor lock-in. The capacity reclamation is immediate: 40% of primary capacity is freed without a hardware purchase, without system changes, and without disrupting any file-based access for users or apps. At current market rates, enterprises that right-place cold data before committing to a flash refresh can identify savings of $350,000 or more per petabyte — a compelling case for data right-placement as a first-line capacity strategy. This is the difference between descriptive vs prescriptive analytics: moving from "here is how full your resources are" to "here is exactly what to do about it."
What-If Scenario Modeling for Refresh and Growth Decisions
What-if scenario modeling — also called interactive modeling or simulation analysis — allows IT teams to model the capacity impact of different tiering policies, growth trajectories, and hardware refresh cycles before committing budget. A purpose-built platform with policy modeling capabilities can answer questions like: "If we tier all files not accessed in 12 months to a cloud repository, how much primary capacity do we reclaim? How does that change our time-to-full projection? How much of the planned refresh budget can we defer?" This kind of prescriptive analytics capability transforms capacity planning from a periodic exercise into a continuous, quantifiable discipline with measurable ROI.
Here is a real-world planning simulation example: an IT team is projecting time-to-full for their primary NAS environment at 14 months at the current annual growth rate. Running a what-if modeling simulation that applies a tiering policy moving all inactive data older than 90 days to a cloud object repository extends the time-to-full projection to 38 months — nearly three years of additional runway, achieved without a hardware purchase. The team can now present a defensible assessment — including a flash stretch assessment and pre-purchase analysis — to finance leadership, demonstrating exactly how the refresh deferral was calculated, what the capacity savings are, and what the budget implications are over the next three years. This level of rigor supports both it budgeting and capital expenditure planning at the executive level, while giving administrators the actionable recommendations they need to execute the plan. Smart data workflows and automated policy enforcement then maintain the tiering discipline continuously, so the gains do not erode over time through data policy enforcement gaps.
Why Vendor-Native Tools Fall Short of Full-Environment Visibility
Most enterprise systems include built-in capacity monitoring. Storage-specific tools from NetApp, Dell Technologies, and HPE provide capacity dashboard views, utilization metrics, and growth trend summaries within their own ecosystems. These tools are effective within a single vendor environment but have no visibility into capacity across other vendors or hosted environments. They answer the question of how full resources are getting — but not what is consuming them, whether that data should still be on primary storage, or what the quantified impact of right-placing data would be. Cloud management tools from AWS, Azure, and Google Cloud provide cloud lifecycle policies and utilization analytics within their respective systems but create blind spots for on-premises NAS environments. Storage area network and block device tools address structured workloads and database storage performance effectively but offer little insight into the unstructured data challenge that lives in file and object environments. The common limitation is that all vendor-native tools are scoped to their own hardware — they cannot provide visibility across all silos simultaneously, which is exactly what effective storage capacity planning requires.
Storage-Agnostic Planning Across Multi-Vendor Environments
A vendor agnostic, storage agnostic approach to resource planning eliminates the blind spots that vendor-native tools create. A global metadatabase architecture — built by scanning all multi-vendor NAS, multi-vendor storage, on-premises storage, and hosted environments without agents — creates a unified view of the entire storage estate in a single platform. This hybrid storage estate visibility enables deep analytics and precision queries across file shares, NAS archives, on-premises NAS, and cloud object repositories simultaneously. From that unified index, teams can run data inventory and file inventory queries by any combination of metadata — file type, file size, owner, data access history, custom tags — to identify exactly which data is cold, which carries duplicate files or redundant data, and which is misplaced data consuming expensive primary capacity it does not need. Continuous visibility and infrastructure monitoring across the full resource footprint — including hybrid nas, hybrid file storage, and cloud migration targets — means that scanning runs constantly, not just during quarterly reviews. This approach supports open standards and avoids vendor lock-in, ensuring that your resource planning discipline scales with your environment rather than being constrained by any single vendor's tooling. The result is a planning tool that delivers actionable insight — not just metrics — enabling infrastructure teams and administrators to make data-driven decisions that protect both enterprise storage investment and it budget.
Warehouse Storage Capacity Planning: Applying the Same Framework to Physical Distribution
The same four-step methodology that governs data center capacity planning applies directly to physical warehouse resource planning. A warehouse capacity planner measures cubic utilization — the percentage of available vertical and horizontal space actively used — rather than simple floor utilization. Floor utilization measures what percentage of your warehouse floor is occupied by racks or product; cubic utilization rate goes further by measuring the percentage of total available volume (floor area multiplied by clear height) that is actually used for pallet-level storage. Cubic utilization is a more accurate measure because it accounts for vertical space — the most commonly underused dimension in fulfillment and logistics settings.
- Calculate gross volume: Multiply total warehouse dimensions — square footage by clear height (floor to lowest obstruction). A warehouse of 50,000 sq ft with a 30 ft clear height yields 1,500,000 cubic feet of gross volume.
- Subtract non-storage space: Deduct aisle area, staging area, dock doors, office space, and loading zones. In a selective rack layout, aisles alone consume 40–50% of floor area. Staging zones — if left unmanaged — can consume an additional 15% or more of usable space.
- Apply a vertical utilization factor: Selective racking typically uses 75% of available height; drive-in racking reaches around 70%; pallet flow systems achieve up to 80%. Narrow-aisle configurations (8–10 ft) with reach trucks can recover 15–25% of your floor area compared to standard wide aisles (12–13 ft) built for counterbalance forklifts. Very-narrow-aisle setups (5–6 ft) with turret trucks can push aisle space below 25% of total floor area.
- Divide by pallet cube: A standard GMA pallet (48 x 40 x 48 inches) occupies approximately 53.3 cubic feet. Divide usable volume by pallet cube to calculate your estimated pallet position count. A facility of 50,000 sq ft with a 30 ft clear height and selective shelving typically yields 4,000–6,000 pallet positions.
Improving warehouse utilization without adding square footage requires a systematic approach to layout changes and system improvements. Most warehouses leave 30–40% of their clear height unused; adding beam levels to existing selective racks or switching to higher-density systems can unlock hundreds of additional pallet positions. Velocity-based slotting — placing fast-mover SKUs and fast-moving SKUs in the most accessible pick locations near loading doors (the golden zone), and slow movers and low-turnover items in higher or deeper positions — reduces travel time and allows denser configurations for low-velocity items. Right-sizing your shelving means not every SKU needs a full pallet position: carton flow racks, shelving, and mezzanines for smaller items free up pallet-level space for products that require it, increasing overall cubic utilization without scale-out costs. Cross-docking high-velocity items, tightening inbound appointment scheduling, and reducing staging dwell time can shrink your non-productive zone from 15% or more down to under 10%, recovering significant dedicated floor space for optimized use. This kind of dense, higher-yield approach — enabled by recommendations from a free capacity report — is how teams recover capacity and defer growth decisions by 1–3 years.
When should you scale rather than optimize? Consider growth when cubic utilization exceeds 85% (for selective rack) or 90% (for dense storage), when your monthly growth rate will push you past capacity within 12 months, when throughput bottlenecks cannot be resolved through layout improvements alone, or when value-added services like kitting and labeling require additional dedicated floor space that cannot be reclaimed through slotting or shelving changes. The pallet position analysis and growth runway projections generated by a warehouse capacity planner give operations managers the industry benchmarks and optimization potential data they need to make that call confidently — and to present a defensible case to supply chain, logistics, fulfillment, and 3PL stakeholders before committing to adding square footage.
Building a Sustainable Storage Capacity Planning Strategy With Analytics-Driven Tooling
Whether your challenge is measured in terabytes or in pallet positions, the path to sustainable resource management follows the same principles: replace reactive purchasing with forward-looking forecasting, replace aggregate utilization metrics with actionable insight, and replace siloed vendor views with unified cross-platform visibility. Analytics-driven planning — powered by a unified index, deep analytics, and what-if simulation — enables teams and administrators to make data-driven decisions that align storage investment with actual business need. Effective performance management starts here, ensuring that resource allocation decisions are grounded in real data rather than assumptions.
The capacity data you collect today becomes the foundation of every plan you build tomorrow. Enterprises that invest in continuous monitoring, capacity trend reports, time-to-full forecasts, and data tiering strategies consistently report longer intervals between refreshes, lower total cost of ownership, and better alignment between system needs and budget reality. A purpose-built storage capacity planning tool — whether a resource monitor for enterprise data or a warehouse capacity planner for physical operations — is the foundation of that discipline. Good data management practice and infrastructure monitoring together ensure that no part of your environment grows unchecked or unnoticed.
Capacity planning is not a one-time project. It is an ongoing discipline that requires resource planning, infrastructure planning, and workload management to work in concert. When your storage capacity management platform provides predefined reports, out-of-the-box reports, custom reports, and web-based reports alongside in-depth dashboards and comprehensive dashboards, it becomes the connective tissue between IT teams, finance stakeholders, data management leads, and enterprise storage leadership. The result: a system that grows intelligently, costs less to maintain, and is always ready for whatever digital transformation, AI readiness, or hosted computing initiative comes next. FinOps teams benefit from the cost improvement and cloud spend visibility this provides, while purchasing leaders gain the refresh cycle data they need to negotiate effectively with vendors. Data compliance, data governance, and service level agreement obligations are also better served when data lifecycle management is informed by real usage patterns, data behavior, and access patterns — not assumptions. This is the promise of a mature storage capacity management software practice: health metrics, performance and capacity trends, and the overall state of your entire application stack and storage estate, visible in one place, always current, always actionable. With the right platform, you can forecast costs accurately, giving your organization the financial clarity to plan storage investments with confidence.
NTFS, ext4, ZFS, RAID and Snapshot Overhead: Typical Values
- System Reserve (5-15%): Metadata, snapshots, thin provisioning overhead
- File System (1-5%): NTFS ~3%, ext4 ~1-2%, ZFS ~3-5%
- Hot Spares: 1 per 20 drives or 1-2 per RAID group recommended
- Growth Buffer: Consider 20-30% for future growth