

Data Transfer Time Calculator
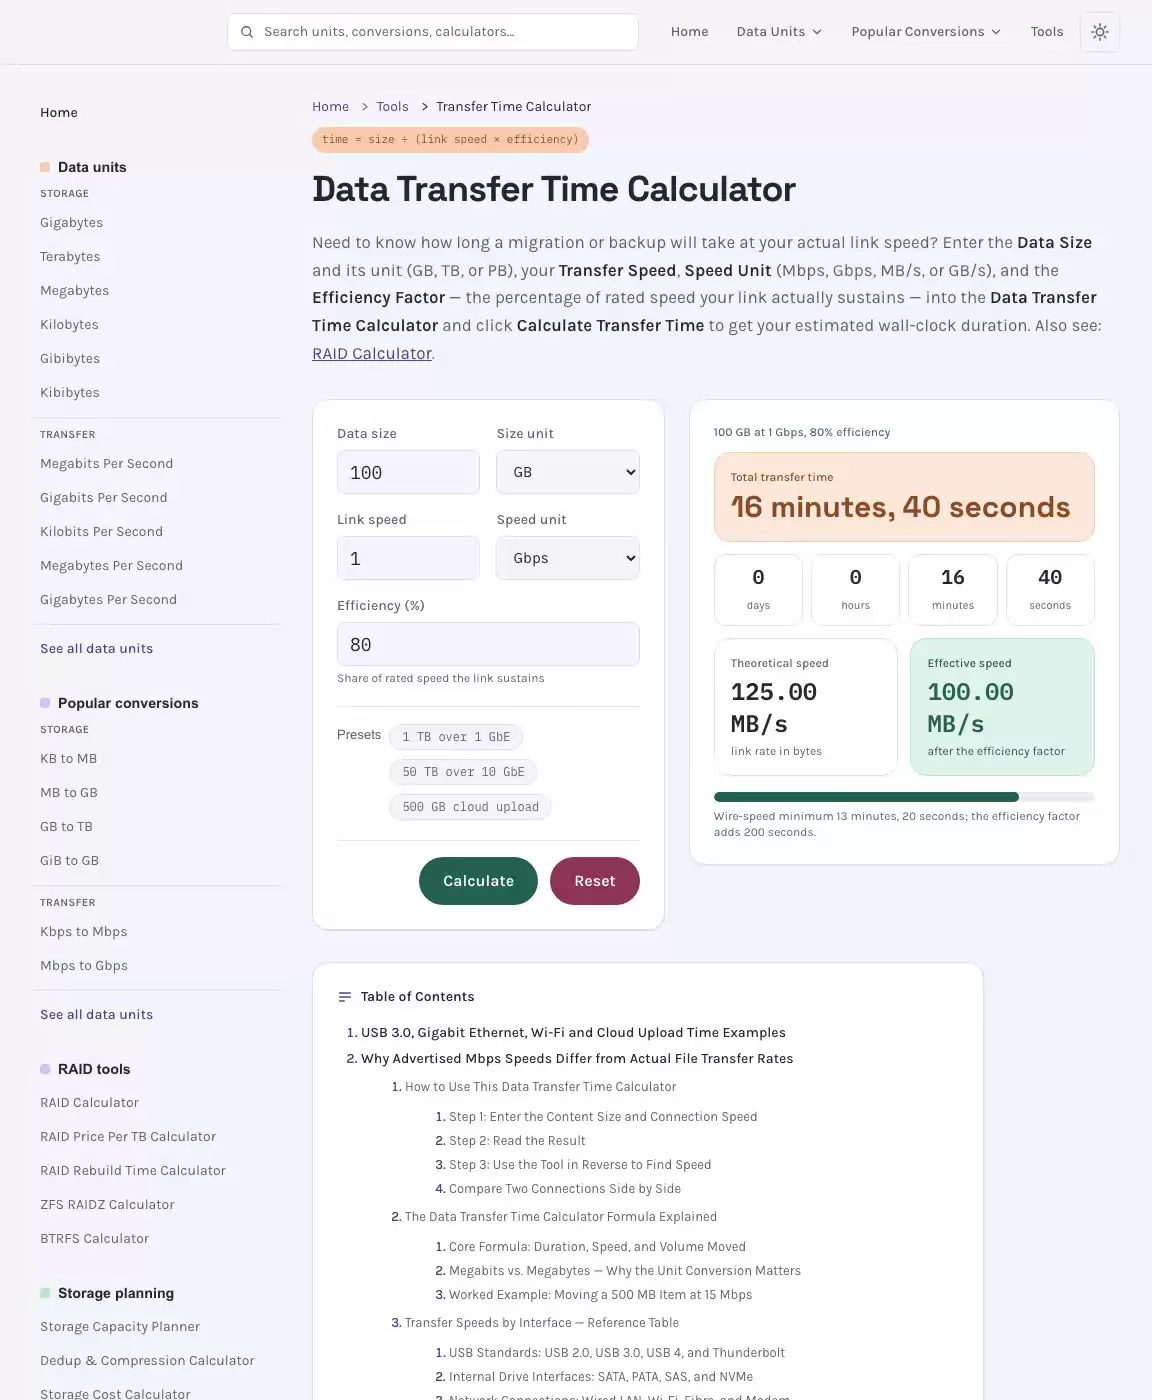
Need to know how long a migration or backup will take at your actual link speed? Enter the Data Size and its unit (GB, TB, or PB), your Transfer Speed, Speed Unit (Mbps, Gbps, MB/s, or GB/s), and the Efficiency Factor — the percentage of rated speed your link actually sustains — into the Data Transfer Time Calculator and click Calculate Transfer Time to get your estimated wall-clock duration. Also see: RAID Calculator.
Results
100 GB at 1 Gbps, 80% efficiency
Total transfer time
Theoretical speed
link rate in bytes
Effective speed
after the efficiency factor
Wire-speed minimum 13 minutes, 20 seconds; the efficiency factor adds 200 seconds.
USB 3.0, Gigabit Ethernet, Wi-Fi and Cloud Upload Time Examples
| Data Size | 1 Gbps | 10 Gbps | 25 Gbps | 100 Gbps |
|---|---|---|---|---|
| 100 GB | ~14 min | ~1.4 min | ~34 sec | ~8 sec |
| 1 TB | ~2.4 hrs | ~14 min | ~5.7 min | ~1.4 min |
| 10 TB | ~24 hrs | ~2.4 hrs | ~57 min | ~14 min |
| 100 TB | ~10 days | ~24 hrs | ~9.5 hrs | ~2.4 hrs |
| 1 PB | ~100 days | ~10 days | ~4 days | ~24 hrs |
* Times shown at 80% efficiency. Actual times may vary.
Why Advertised Mbps Speeds Differ from Actual File Transfer Rates
Whether you're planning a data migration, scheduling a cloud backup, or deciding which cable to use when switching smartphones, knowing the transfer time in advance saves frustration and helps you make smarter decisions. This Data Transfer Time Calculator gives you an instant, accurate estimate of how long any data transfer will take — and it works in both directions, so you can also find the transfer speed when you already know how long a job took. Run your numbers before you commit to a method, a cutover date, or a backup plan.
See the Transfer Time Calculator in Action
How to Use This Data Transfer Time Calculator
The tool above is designed to be a straightforward, free calculator that handles every common transfer scenario — local device transfer, connectivity check, or fetch from the web. Here is exactly how to get the most out of it.
Step 1: Enter the Content Size and Connection Speed
Type your content size into the first field and choose the correct unit from the dropdown — bytes, KB, MB, GB, or TB. A single bulky item like a game download, a large video, or a CAD file is simple to enter directly. If you are moving an entire folder or a photo library migration, add up the total size first. Next, enter your speed in the speed field, or pick a preset from the interface speed dropdown. The preset list covers popular scenarios including USB, SATA, NVMe, Gigabit Ethernet, Wi-Fi, and more — saving you from having to look up rated speeds manually. You can always type a custom speed value if your connection sits between standard presets.
Step 2: Read the Result
The tool instantly displays the estimated completion time broken down into days, hours, minutes, and seconds so the result is always human-readable regardless of whether you are moving a 200 MB image or a 10 TB collection. The result shown is the theoretical floor — an optimistic lower bound based on the rated speed. Real-world results will probably be less than this figure because of framing overhead, filesystem extra work, and equipment variability, so treat it as a realistic minimum.
Step 3: Use the Tool in Reverse to Find Speed
You can also use it in reverse: enter the content size and the actual time a job took (use a stopwatch measurement if needed), and the speed calculator will show your real-world effective rate. This is an excellent reality check — compare the result against your quoted ISP speed or your cable's rated capacity to see how much extra work and contention are costing you in practice.
Compare Two Connections Side by Side
The compare mode lets you run a side-by-side comparison of two interfaces or connection speeds simultaneously. This is especially useful when you are evaluating a spec jump — for example, comparing Gigabit Ethernet versus 10 Gigabit Ethernet for a NAS migration, or benchmarking USB 3.0 against Thunderbolt 4 for an external SSD workflow. Enter your payload size once, and both completion estimates appear together so you can make the call instantly. The delay panel also lets you apply a WAN delay preset (LAN, cross-ocean, orbital) to model how delay and the bandwidth-delay product constrain TCP capacity on long-haul links.
The Data Transfer Time Calculator Formula Explained
Understanding the math behind the data transfer time calculator helps you interpret results intelligently and spot when something is wrong with your connection. The data transfer time formula is built on a single, elegant relationship between three variables. Related: IOPS Calculator.
Core Formula: Duration, Speed, and Volume Moved
The primary calculation for any job is:
Rearranged, the speed formula becomes:
These two forms of the equation cover every scenario. If you know any two of the three values — content size, speed, and time — you can calculate the third. This tool automates all three rearrangements, so you never have to solve manually. Input any two parameters and the third appears as the result immediately. This is what makes the tool function simultaneously as a file transfer speed calculator, a transfer time calculator, and a capacity estimator — a handy companion to a raid calculator or any other infrastructure-sizing tool.
Megabits vs. Megabytes — Why the Unit Conversion Matters
The most common source of confusion — and the reason your estimate might be eight times off — is the difference between megabits per second (Mbps) and megabytes per second (MB/s). Your ISP and most equipment quote speeds in bits per second, while operating systems display sizes in units of data transfer such as bytes. Since one megabyte is eight times larger than one megabit — because there are eight binary digits in one byte — you must convert before dividing. This is the key principle behind understanding mbps units and units of data transfer more broadly.
In practical terms: a 50 Mbps connection delivers 50 ÷ 8 = 6.25 MB/s of actual network speed. Drive manufacturers sometimes use a decimal convention where 1 GB = 1,000,000,000 bytes following the SI convention, while computing traditionally uses 1 GB = 1024³ bytes, and the same applies to the 1000-byte vs. 1024 split at the megabyte level. This tool handles the byte conversion automatically once you select the correct units, eliminating this confusion entirely. Always check whether your size figure has been converted correctly — 1 byte equals 8 bits is the golden rule.
Speed is most commonly expressed in Mbps for web connections, MB/s for storage interfaces, and gigabytes per second (GB/s) for the fastest NVMe drives. The tool accepts all of these, converting internally for an accurate result.
Worked Example: Moving a 500 MB Item at 15 Mbps
Let's walk through the classic example of a 500 MB file over a 15 Mbps connection step by step so you can see exactly how the data transfer time formula works in practice:
- Identify the size in megabytes: 500 MB
- Convert to megabits using the rule that one megabyte equals eight megabits: 500 × 8 = 4,000 Mb
- Apply the duration formula: duration = 4,000 Mb ÷ 15 Mbps
- Calculate: duration = 266.67 seconds = 4 min 26 sec
This is the theoretical duration at a sustained 15 Mbps rate. In practice, web speeds fluctuate, so the actual completion time may be slightly longer. The formula gives you a realistic minimum — a reliable lower bound for your scheduling. This tool performs the unit conversion and division automatically, showing the result in days, hours, minutes, and seconds.
Transfer Speeds by Interface — Reference Table
Not all interfaces are equal, and choosing the right one for your job can mean the difference between a two-minute job and a three-hour wait. The table below lists the data transfer rate for every major interface, both as a theoretical speed and a typical real-world rate after accounting for framing overhead, USB framing, and standard losses. Use this as a quick reference alongside the tool above.
USB Standards: USB 2.0, USB 3.0, USB 4, and Thunderbolt
USB speeds span a huge range across generations. USB 2.0 tops out at 480 Mbps theoretical — roughly 40–50 MB/s in real-world conditions, making it the slowest modern connector standard. USB 3.0 (also marketed as USB 3.2 Gen 1) delivers up to 5 Gbps theoretical, or approximately 625 MB/s at the interface level, though sustained disk-to-disk speeds are typically 300–400 MB/s due to drive bottlenecks. USB 4 doubles this again to 40 Gbps, matching Thunderbolt 3 and Thunderbolt 4, which both offer 40 Gbps maximum over a USB-C port. Using high-speed USB 3 cables instead of older USB 2 connectors is one of the quickest free upgrades for any cable-based phone transfer workflow. Note that connector speed can vary with cable length, the number of switching points in the chain, and other interfaces connected — always select the slowest link in your chain to set a realistic maximum.
Internal Drive Interfaces: SATA, PATA, SAS, and NVMe
Drive interfaces define the speed ceiling for any local device transfer or on-disk job. PATA (Parallel ATA), the oldest technology in common use, peaks at around 133 MB/s. SATA (specifically SATA II and SATA III) supports up to 600 MB/s, which is enough to saturate a SATA SSD but leaves headroom for most spinning-disk transfers. SAS (Serial Attached SCSI) scales beyond 24 Gbps in modern implementations, making it a favourite for enterprise NAS and server equipment. NVMe, connected directly over PCIe, shatters all of these — NVMe Gen4 drives regularly hit 7,000 MB/s sequential read, making them the fastest internal option available. This tool's preset list includes all of these so you can model any internal drive scenario without manual lookup.
Network Connections: Wired LAN, Wi-Fi, Fibre, and Modem
Equipment ranges from slow broadband modem connections to screaming 10 GbE infrastructure. Ethernet at the classic 100 Mbps Fast Ethernet standard is now largely superseded by Gigabit Ethernet (1 Gbps) in home and small-business environments. 2.5 GbE and 10 Gigabit Ethernet (10 GbE) are increasingly common in home server and enterprise settings. Wi-Fi via WiFi 5 (802.11ac) offers theoretical peaks around 3.5 Gbps, though real-world speeds are far lower due to interference, encryption extra work, and distance. WiFi 6 (802.11ax) and WiFi 6E improve capacity and responsiveness for dense environments, while WiFi 7 pushes multi-Gbps theoretical rates. Fibre full-duplex services can deliver symmetric speeds that match or exceed Gigabit Ethernet with low delay. For WAN and remote transfers, WAN delay and the bandwidth-delay product impose a TCP capacity ceiling that can be far below the raw link capacity — more on this in the FAQ section below.
| Interface | Theoretical Max Speed | Typical Real-World Speed | Approx. Time to Transfer 1 TB |
|---|---|---|---|
| Modem (ADSL) | 24 Mbps | 8–18 Mbps | ~5–14 days |
| USB 2.0 | 480 Mbps | ~320 Mbps (~40 MB/s) | ~5.6 hours |
| Ethernet (100 Mbps) | 100 Mbps | ~80–90 Mbps | ~25 hours |
| Firewire 800 | 800 Mbps | ~70–90 MB/s | ~3.1–3.9 hours |
| PATA | ~133 MB/s (1,064 Mbps) | ~90–120 MB/s | ~2.3–3.1 hours |
| USB 3.0 / USB 3.2 Gen 1 | 5 Gbps (~625 MB/s) | ~300–400 MB/s | ~42–56 minutes |
| SATA III (SATA SSD) | 600 MB/s (4,800 Mbps) | ~450–550 MB/s | ~31–37 minutes |
| Gigabit Ethernet (1 GbE) | 1 Gbps | ~700–900 Mbps | ~2.5–3.2 hours† |
| WiFi 5 (802.11ac) | ~3,500 Mbps | ~200–600 Mbps | ~3.7–11 hours |
| WiFi 6 (802.11ax) | ~9,600 Mbps | ~400–1,200 Mbps | ~1.9–5.6 hours |
| USB 4 / Thunderbolt 4 | 40 Gbps | ~3,000–5,000 MB/s | ~3.3–5.6 minutes |
| 10 Gigabit Ethernet (10 GbE) | 10 Gbps | ~7,000–9,000 Mbps | ~15–19 minutes |
| SAS (24 Gbps) | 24 Gbps | ~2,000–2,800 MB/s | ~6–8 minutes |
| NVMe Gen4 (PCIe) | ~7,000 MB/s (56 Gbps) | ~5,000–6,500 MB/s | ~2.6–3.4 minutes |
† Gigabit Ethernet completion times for a one-terabyte payload reflect real-world TCP capacity after framing overhead; the theoretical minimum at a full link rate of 1,000 Mbps is approximately 8,000 seconds (~2 hr 13 min), but practical estimates of 3–4 hours are more common due to extra work and drive speed.
The table above shows pre-computed times based on rated and typical speeds. Because connectivity speed units (Mbps) differ from the units used for drive capacity, always confirm which convention your equipment uses. Drive manufacturers often quote capacity using the SI convention (1,000,000,000 bytes per GB), while networking follows the strict powers-of-ten definition. This tool handles both, but it's worth understanding the distinction when your numbers seem off.
Real-World Scenarios: File Management, Data Backup, and File Sharing
Abstract formulas are useful, but most people want to know the answer to a specific question. Here are three fully worked real-world examples covering common file management, data backup, and file sharing jobs — each one is also a single click in the calculator above if you prefer to skip the manual math. See also: BTRFS Calculator.
How Long Does It Take to Fetch Windows 11?
The Windows 11 payload depends on whether you are upgrading from Windows 10 or performing a fresh installation. An upgrade scenario requires approximately 3.5 GB, while the ISO for a clean installation weighs in at 5.37 GB. The table below shows estimated time at three common connection tiers. All times assume a sustained rate with no other traffic competing for capacity.
| Scenario | Size | At 25 Mbps | At 50 Mbps | At 100 Mbps | At 1 Gbps |
|---|---|---|---|---|---|
| Upgrade from Windows 10 | 3.5 GB | ~18 min 40 sec | 9 min 20 sec | ~4 min 40 sec | ~28 sec |
| Clean install ISO (5.37 GB) | 5.37 GB | ~28 min 38 sec | 14 min 19 sec | ~7 min 10 sec | ~43 sec |
The approximately 9-minute figure for the upgrade path and the roughly 14-minute figure for the full ISO are calculated at exactly 50 Mbps, giving 6.25 MB/s of actual throughput after the bits-to-bytes conversion. On a slow connection at 25 Mbps the upgrade would take around 18 minutes. At a gigabit fibre connection the entire Windows 11 retrieval is done in under a minute. Use the fields above if your actual ISP speed differs from these tiers — just type your own Mbps value.
How Long to Move 1 TB over Gigabit Ethernet?
Moving a one-terabyte payload across a Gigabit Ethernet link is a benchmark scenario for home server migrations, NAS upgrades, and migration projects. This is also a classic local transfer case — a transfer from device to NAS over a switched connection. Here is the step-by-step calculation:
- Convert size to megabits: 1 TB = 1,000,000 MB × 8 = 8,000,000 Mb
- Apply the formula at theoretical 1,000 Mbps: duration = 8,000,000 Mb ÷ 1,000 Mbps = 8,000 seconds
- Convert: 8,000 ÷ 3,600 ≈ 2 hr 13 min — the theoretical minimum.
- Apply real-world extra work: Accounting for TCP framing, filesystem overhead, metadata overhead, and drive-speed limits, a realistic estimate is 3–4 hours.
The gap between the theoretical floor and real-world time is caused by several factors: link utilization rarely reaches 100%, a firewall or middlebox may introduce processing delay, the source disk may not sustain maximum speed, and small-file latency from thousands of tiny items in a folder can dramatically inflate the completion duration. Tools like rsync or SMB Multichannel can improve throughput on structured jobs. If you need a one-off move quickly, consider using a parallel-stream tool or a direct NVMe-to-NVMe transfer via an external SSD to avoid the Ethernet bottleneck entirely.
Archiving Files over a Reasonably Fast Connection
Suppose you want to archive a 50 GB photo library to a remote storage service — Google Cloud, Microsoft's platform, or any other provider — over a home broadband connection rated at 50 Mbps upload. Here is the calculation:
- Convert size: 50 GB × 1,000 MB/GB × 8 bits/byte = 400,000 Mb
- Apply the formula at 50 Mbps: duration = 400,000 Mb ÷ 50 Mbps = 8,000 seconds ≈ 2 hr 13 min
- Reality check: Your actual upload rate is almost certainly below the provider's rated figure. At a realistic 6.25 MB/s (50 Mbps), any background syncs or competing machines will reduce your effective rate further.
A 50 Mbps connection is sufficient for casual remote archiving, but if you need to push 100 GB or more regularly, consider scheduling jobs overnight using a resumable-upload tool. Real speeds will probably be less than the quoted ISP figure because of congestion, encryption processing, and WAN delay. This tool gives you the optimistic floor — add 20–40% buffer time for a realistic project schedule and a safe cutover date.
For large jobs in enterprise environments — such as moving a 200 GB virtual machine image or a multi-terabyte collection during a VMware migration — the same formula applies, but WAN delay, the bandwidth-delay product, and the TCP receive window become critical. A window-limited TCP connection over a cross-ocean link with 80 ms RTT can be capped to a fraction of the raw link rate unless TCP window scaling (defined in RFC 1323) is enabled to expand the receive window and the window size beyond 65 KB. Without it, the TCP throughput ceiling is determined by: max throughput = TCP window size ÷ RTT, which can easily drop a high-speed link to single-digit Mbps effective throughput on a long-haul or orbital path. The delay panel in this tool's compare mode models this effect so you can see the real effective rate for your WAN scenario.
Moving Content Between Devices: Android, iPhone, and PC Transfers
Machine-to-machine transfers involve all the same physics as any other job — the same formula, the same interface bottlenecks, and the same gap between rated and real-world speed. The difference is that mobile phones and smartphones introduce additional variables: app-level rate limits, cloud intermediaries, and the choice between cable and radio paths. Good connectivity and the right network speed make all the difference for smooth file sharing and data backup between machines.
Switching from Android to iPhone: App-Based and Cable Methods
If you are moving from Android to iPhone, the most common method is Apple's transfer app called Move to iOS, which works over a direct Wi-Fi connection between the two machines. This is convenient but limited by your devices' radio performance and the size of your payload — use the tool above with a typical WiFi 5 speed of around 200 Mbps to get an approximate time before you start. For a faster phone migration, plug both machines into your PC using USB cables and use a desktop transfer app to move items directly. Use high-speed USB 3 cables wherever possible — the difference between the older standard's 480 Mbps and the newer USB 3.0's 5 Gbps is enormous for a large contacts migration, photos move, or full-device duplication. A cable with USB 3.0 support is the cheapest equipment upgrade you can make for this job. If you only need to move specific items like photos or contacts, you can sign up for a remote service such as Google's platform or Microsoft's cloud, sync from Android, then sign into the same account on your iPhone to access your content without any cable at all.
iPhone to iPhone: iCloud, Quick Start, and iTunes Backup
For an iPhone-to-iPhone migration from one iOS device to another, you have three main options. The first is iCloud Quick Start, which wirelessly streams content from your old iPhone to the new one over your home network — speed depends entirely on your connection and the size of your iCloud archive. The second option is to save your old iPhone to your computer using iTunes (or Finder on modern macOS), then restore from that saved snapshot on the new device via cable. This is significantly faster because it eliminates the remote leg — speed is then governed by your USB interface and your on-board drive, making it an excellent choice when your connection is slow. The third option for large moves is to selectively export iPhone content using a third-party archiving app and then restore only what you need, which reduces the total volume moving across the link. Always run your estimated content size through the calculator before committing to a method — a remote restore of 50 GB over a 10 Mbps connection will take over 11 hours, while the same job over a USB 3.0 cable to your PC completes in minutes.
Choosing the Fastest Method Based on Your Volume and Speed
The right method depends on three factors: content size, available connection speed, and the equipment in your interface chain. For moves under 1 GB, Wi-Fi or a remote service is usually the most convenient option without significant time penalty. For moves between 1 GB and 100 GB, a cabled USB 3.0 or USB-C connection is almost always faster than remote methods unless you have fibre. For moves above 100 GB — such as a full phone archive, a PC backup job, or a computer duplication task — cabled Ethernet or direct NVMe-to-drive copy is the only practical solution. The estimator above quantifies the difference instantly: enter your content size, compare cabled vs. radio options in the side-by-side comparison mode, and let the numbers guide your decision. Planning for a remote migration or a big copy job? The data transfer time calculator is your first step before committing equipment or scheduling downtime.
How do I calculate the transfer time of data?
To calculate the completion time, use the core formula: divide content size by speed. First, make sure both values are in compatible units — convert your size from megabytes to megabits (multiply MB by 8), then divide by your speed in Mbps. The result is in seconds. For example, a 500 MB item at 15 Mbps: (500 × 8) ÷ 15 = 266.67 seconds, or 4 min 26 sec. The data transfer time calculator above automates the unit conversion and handling for you.
What is the data transfer rate of USB 3.0?
USB 3.0 has a theoretical maximum data transfer rate of 5 Gbps, which translates to approximately 625 MB/s at the interface level. Real-world sustained speeds for a drive connected via this standard are typically 300–450 MB/s depending on the storage device, cable quality, and any switching points in the chain. This makes it dramatically faster than the older USB 2.0 standard's 480 Mbps (~40 MB/s real-world), and sufficient for all but the fastest NVMe external SSDs.
What's the difference between megabits (Mbps) and megabytes (MB/s)?
A megabit is one million binary digits, while a megabyte is one million groups of eight. Because there are eight bits in every byte, one megabyte is eight times the size of one megabit. Your ISP quotes capacity in megabits per second (Mbps), while your operating system shows sizes in MB/s. Always multiply your MB size by 8 before dividing by your Mbps speed. A high-speed fibre connection of 1,000 Mbps delivers 125 MB/s of actual throughput — not 1,000 MB/s. This tool handles this automatically.
Why is my real transfer speed slower than the cable's rated speed?
Every real-world job involves overhead: USB framing, filesystem extra work, metadata processing, handshaking, and the source or destination drive's own speed limit. The link rate is the ceiling; your actual throughput is always below it. Factors like cable length, the number of switching points, and whether multiple jobs are running simultaneously all reduce effective speed. This tool shows you the theoretical floor — treat it as a realistic minimum and budget additional time for real jobs.
Why is my WAN or remote transfer so much slower than my connection speed?
On a WAN or remote transfer, TCP's window size limits how much in-flight content can be outstanding at any moment. The bandwidth-delay product — calculated as link rate × round-trip time (RTT) — defines how large the TCP window must be to fully utilise the link. Over a cross-ocean or orbital link with a high round-trip time, a default receive window of 65 KB caps effective throughput far below the raw capacity. Enabling TCP window scaling (RFC 1323) expands the receive window so the sender can keep the pipe full. A load balancer, firewall, or other middlebox that resets the window size can re-introduce this bottleneck even on a patched system.
How does network latency affect file transfer time?
Delay — measured as RTT (round-trip time) — matters most for TCP-based jobs over a WAN. Each acknowledgment round-trip pauses the sender. High delay effectively reduces link utilization achievable unless the TCP window is large enough to keep content in flight between acknowledgments. For local transfers over Gigabit Ethernet within a single site, delay is typically sub-millisecond and has negligible impact. For cross-site or remote migration scenarios, delay is often the dominant factor in determining your actual effective rate.
How long does it take to download Windows 11?
Upgrading from Windows 10 requires approximately 3.5 GB, which takes about 9 minutes 20 seconds at 50 Mbps. A clean installation ISO weighs about 5.37 GB, taking roughly 14 minutes 19 seconds at the same speed. At 25 Mbps, expect roughly double those times. At very high speeds, both complete in well under a minute. Use the calculator above with your actual connection speed for a personalised estimate.
How long does it take to transfer 1 TB over Gigabit Ethernet?
At a full theoretical 1,000 Mbps, moving one terabyte takes (1,000,000 × 8) ÷ 1,000 = 8,000 seconds — approximately 2 hours 13 minutes. In practice, accounting for TCP framing, filesystem overhead, and drive speed, plan for 3–4 hours. Upgrading to a 10 GbE setup reduces this to 15–19 minutes at real-world speeds. Use this tool with your actual link speed for a project-specific estimate.
How fast is WiFi 6 compared to Gigabit Ethernet for file transfers?
WiFi 6 has a theoretical peak around 9,600 Mbps, but real-world throughput is 400–1,200 Mbps depending on signal quality, interference, and client equipment. Cabled Gigabit Ethernet delivers a consistent 700–900 Mbps with much lower delay and zero radio interference. For sustained large-volume jobs — moving a NAS collection, for example — cabled is almost always faster and more reliable. For a one-off move of a small item, either is fine; for anything over 10 GB, choose a cable if the option exists.
Does file structure affect transfer speed?
Yes — significantly. A single large item transfers at close to the interface's maximum throughput. Thousands of small items introduce small-file latency: each requires a separate filesystem operation, and the overhead per item can dominate the total duration. A folder with 100,000 tiny files may move far more slowly than a single archive of the same total size. Compress or bundle small-file collections before moving (e.g. using ZIP or tar) to reduce this overhead. Tools like rsync and SMB Multichannel handle this more efficiently than a naive copy.
What is TCP window scaling and should I enable it?
TCP window scaling (defined in RFC 1323) extends the maximum TCP receive window from 65 KB to over 1 GB, allowing the sender to keep large amounts of content in flight without waiting for acknowledgments. It is critical for high-speed WAN links with significant RTT. Without it, the TCP throughput ceiling is window size ÷ RTT. On modern operating systems, window scaling is enabled by default, but some firewalls and middleboxes strip the option during TCP negotiation. If your WAN delay is high and your throughput is unexpectedly low, check that your equipment and any load balancer in the path preserve TCP window scaling options.
Is USB 4 or Thunderbolt 4 faster for copying files?
Both USB 4 and Thunderbolt 4 share the same 40 Gbps maximum capacity and use the USB-C connector, so their theoretical speeds are identical. In practice, Thunderbolt 4 enforces stricter certification requirements, guaranteeing minimum performance and PCIe tunnelling support, while USB 4 device quality varies more widely. For pure move speed to an external SSD, both are effectively equivalent — your storage device's sustained write speed is the real bottleneck, not the interface. A high-end NVMe external SSD connected via either will hit 2,000–3,000 MB/s in real-world use.
What is data transmission speed?
Data transmission speed — also called data transfer speed or link rate — is the amount of content moved across a connection per unit of time. It is expressed in bits per second (bps) and scaled up using SI prefixes: kilobits (Kbps), megabits per second (Mbps), gigabits (Gbps), or gigabytes per second. The average rate across a full job is what the data transfer time formula uses, since real-world speeds fluctuate due to congestion, signal-to-noise ratio, and equipment variability. The signal-to-noise ratio of the physical channel sets an upper bound on throughput in radio and DSL systems.
How do I calculate data transfer speed?
To calculate your effective speed: move a known item, note its size, then time the job using a stopwatch or the browser's progress indicator. Divide the size (converted to bits) by the elapsed time in seconds to get bits per second, then divide by 1,000,000 to get Mbps. Alternatively, enter the size and the measured time into the reverse mode of the data transfer time calculator above and it will output the data transfer speed instantly. This is an excellent way to verify whether you are getting the correct throughput from your internet service provider. The noise figure of your modem or router's RF front-end can also affect effective throughput on radio broadband connections, which is why a noise figure calculator is a useful companion tool for diagnosing slow wireless speeds.
Overhead, Compression, Protocol and Drive Speed Impact on Transfer Time
- LAN transfers (90-95%): Direct connections with minimal overhead
- Enterprise networks (70-85%): Typical datacenter with some congestion
- WAN/Internet (50-70%): Long-distance transfers with higher latency
- Cloud uploads (40-60%): Variable based on provider and location