

Storage Cost Calculator
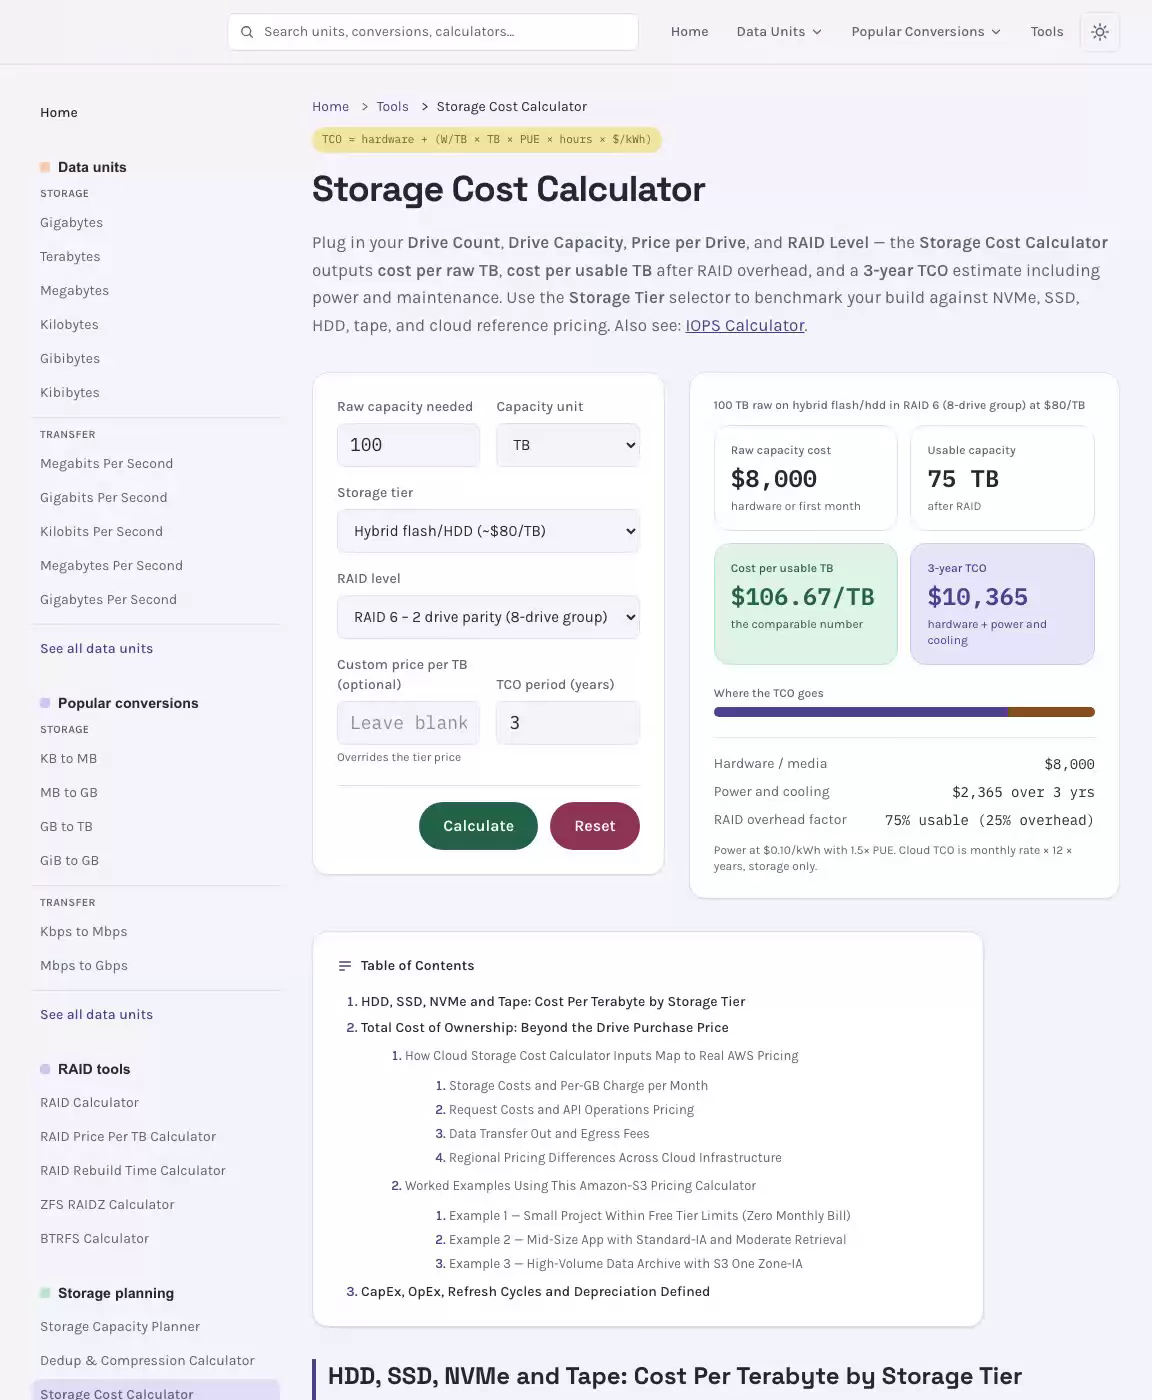
Plug in your Drive Count, Drive Capacity, Price per Drive, and RAID Level — the Storage Cost Calculator outputs cost per raw TB, cost per usable TB after RAID overhead, and a 3-year TCO estimate including power and maintenance. Use the Storage Tier selector to benchmark your build against NVMe, SSD, HDD, tape, and cloud reference pricing. Also see: IOPS Calculator.
Results
100 TB raw on hybrid flash/hdd in RAID 6 (8-drive group) at $80/TB
Raw capacity cost
hardware or first month
Usable capacity
after RAID
Cost per usable TB
the comparable number
3-year TCO
hardware + power and cooling
Where the TCO goes
- Hardware / media
- Power and cooling
- RAID overhead factor
Power at $0.10/kWh with 1.5× PUE. Cloud TCO is monthly rate × 12 × years, storage only.
HDD, SSD, NVMe and Tape: Cost Per Terabyte by Storage Tier
| Storage Type | Price Range / TB | Avg Price / TB | Power | Best For |
|---|---|---|---|---|
| NVMe All-Flash Array | $200–$500 | $300 | ~3W/TB | Tier-0 databases, latency-sensitive |
| All-Flash (SAS/SATA SSD) | $100–$300 | $180 | ~4W/TB | Primary storage, VMs |
| Hybrid Flash/HDD | $50–$150 | $80 | ~6W/TB | Mixed workloads, tiered storage |
| Enterprise SAS HDD | $30–$80 | $50 | ~8W/TB | Near-line, secondary storage |
| SATA HDD / NAS Drive | $15–$35 | $25 | ~5W/TB | NAS, home lab, cold data |
| LTO Tape (media only) | $5–$15 | $8 | 0 (offline) | Long-term archive, offsite DR |
| Cloud – S3 Standard | $23–$25/mo | $23/mo | — | Active cloud-native workloads |
| Cloud – S3 Glacier | $3–$5/mo | $4/mo | — | Cold archive, infrequent access |
Total Cost of Ownership: Beyond the Drive Purchase Price
Ever stared at an Amazon S3 bill and wondered exactly where those charges came from? This storage cost calculator gives you an instant, transparent breakdown of your monthly costs — so you can make confident decisions about storage classes, request volumes, and data transfer strategy before a surprise bill lands in your inbox. Whether you're planning a new workload or auditing existing cloud spend, knowing your real cost estimate upfront puts you in control.
See the Storage Cost Calculator in Action
How Cloud Storage Cost Calculator Inputs Map to Real AWS Pricing
Cloud computing charges for object storage are built from three distinct cost dimensions, and missing even one of them will leave your monthly estimate dangerously optimistic. Understanding how each input feeds the final costs helps you use this pricing calculator — and cross-check any manual calculation — with confidence. The calculator follows publicly available pricing and mirrors the structure of the Amazon pricing API, so figures reflect what you'll actually encounter in the cloud billing console. Remember: this is a good faith estimate; pricing is subject to change, and actual charges may differ if you hold commitment discounts, enterprise agreements, or promotional credits. Related: NVMe PCIe Bandwidth Calculator.
Storage Costs and Per-GB Charge per Month
All providers charge per unit of data held monthly, but the storage class rate varies substantially across Amazon S3's pricing tiers. S3 Standard — the default hot storage tier for frequently accessed data — carries the highest rate per gigabyte. Moving to S3 Standard-IA (Standard-Infrequent Access) cuts the rate significantly, making it attractive for data accessed less than once a month, though it introduces retrieval fees on every read. S3 One Zone-IA drops the price further by holding data in a single Availability Zone instead of three, offering meaningful savings for reproducible datasets where availability trade-offs are acceptable. S3 Intelligent-Tiering automatically moves objects between access tiers and is ideal when your access pattern is unpredictable. For true archive storage and long-term backups, Glacier and Glacier Instant Retrieval offer the lowest rates of all storage classes, though data retrieval costs and latency increase accordingly.
The core formula for the repository component is:
Storage charge = GB stored × storage class rate (per GB per month)With tiered rates, the price itself decreases as your data volume grows — for example, the first 50 TB monthly in us-east-1 is priced differently from the next 450 TB. Always consult the vendor's official reference pages to confirm the slab that applies to your usage.
Request Costs and API Operations Pricing
Request costs are the most frequently overlooked line item on a platform invoice. Every file operation — uploading, downloading, listing, or deleting an object — counts as an API request. The provider charges per thousand requests, with write operations (PUT, COPY, POST, LIST) priced higher than read operations (GET, SELECT). For tasks involving many small files, api requests can easily exceed repository fees as a share of the total monthly invoice. To configure products and model the number of servers making API calls, enter your expected request volumes directly into the calculator fields.
The request cost formula breaks into two components:
And the combined monthly cost formula — which this estimator automates — looks like this in plain terms:
monthly_cost = (storage_gb * price_per_gb) + (put_requests / 1000 * put_rate) + (get_requests / 1000 * get_rate) + (data_transfer_out_gb * transfer_rate)
Read requests and write requests are invoiced separately and at different rates depending on the tier. For example, S3 Standard-IA read requests cost more than equivalent S3 Standard reads, which can erase the per-unit savings if you retrieve data frequently. Strategies like consolidating small files into larger objects or using S3 Batch Operations for bulk tasks can reduce your per-1,000-request spend meaningfully when large volumes of operations accumulate.
Data Transfer Out and Egress Fees
Outbound transfer — specifically data transfer out to the internet — is invoiced per gigabyte and can become one of the largest components of your cloud costs. Uploads are free into the service from the internet, but downloading data carries a charge that ranges roughly from $0.08 to $0.09 per unit of data depending on volume, with tiered pricing that decreases at higher usage levels. Moves between geographic zones also incur transfer charges, while transfers within the same zone to other platform services are typically free or discounted.
Outbound transfer fees formula:
Transfer charge = data transfer out (GB) × transfer rate (per GB)The bandwidth cost is particularly significant for media-heavy applications, research data repositories, or any task that regularly serves large objects to end users. Planning your architecture around cost optimization — for instance, using Amazon CloudFront to cache frequently requested objects — can dramatically reduce the outbound portion of your monthly invoice. This tool includes outbound transfer as a direct input so you can model that impact before committing to an architecture.
Regional Pricing Differences Across Cloud Infrastructure
Regional pricing adds another layer of variability. The provider does not charge the same rate for every geographic location: US zones like us-east-1 (Northern Virginia) are typically the cheapest, followed by European locations. Asia-Pacific, Middle East, and South America geographic areas generally carry a premium on both capacity and api operations compared to their US equivalents. Selecting a location close to your users improves performance and reduces latency, but you should factor the regional pricing differences into your cost review — especially if your data needs to comply with data-residency or FedRAMP compliance requirements. The power of servers in your chosen zone also influences latency and indirectly affects how often data must be transferred.
This storage cost calculator accounts for regional pricing by allowing you to select your target deployment zone, so the cost details reflect the correct invoiced rate for your chosen geography rather than a global average, expressed in your preferred currency. Always cross-reference against the vendor's official reference pages before finalising production budgets.
Worked Examples Using This Amazon-S3 Pricing Calculator
Walking through realistic scenarios is the fastest way to internalise how tier selection, usage volume, and request patterns interact to determine your monthly S3 costs. The three examples below span small projects, mid-size applications, and high-volume archive tasks — covering the most common use cases teams reach for an aws pricing tool to solve. See also: Storage Capacity Planner.
Example 1 — Small Project Within Free Tier Limits (Zero Monthly Bill)
A developer builds a personal portfolio site holding static assets in S3 Standard. Their usage for the month:
- Capacity: 5 GB in S3 Standard
- Write requests: 2,000 (file uploads during deployment)
- Read requests: 20,000 (visitors retrieving images and scripts)
- Data transfer out: under 1 GB
- Capacity charge: 5 GB is fully covered by the AWS Free Tier (5 GB S3 Standard capacity free for the first 12 months on new platform accounts). Charge = $0.00
- Request charge: 2,000 write requests and 20,000 read requests both fall within free tier limits. Charge = $0.00
- Transfer charge: Under 1 GB of outbound transfer is negligible and within free tier. Charge = $0.00
- Monthly estimate: Total = $0.00 + $0.00 + $0.00 = $0.00
This scenario illustrates why the free tier benefits and visual free tier tracking in the calculator matter — staying within these thresholds means genuinely zero charges for lightweight projects.
Example 2 — Mid-Size App with Standard-IA and Moderate Retrieval
A SaaS application holds user-generated documents accessed roughly once a month. The team decides S3 Standard-IA (standard-ia) offers a good balance. Monthly figures:
- Capacity: 500 GB in S3 Standard-IA at ~$0.0125 per gigabyte
- Write requests: 50,000
- Read requests: 200,000
- Outbound transfer: 50 GB
- Capacity charge: 500 × $0.0125 = $6.25
- Write charge: 50,000 ÷ 1,000 × $0.01 = $0.50
- Read charge + access fees: Standard-IA charges both a read rate and a per-GB retrieval fees component. Assuming $0.001 per 1,000 reads and $0.01 per GB retrieved (50 GB): 200,000 ÷ 1,000 × $0.001 + 50 × $0.01 = $0.20 + $0.50 = $0.70
- Transfer charge: 50 × $0.09 = $4.50
- Monthly costs total: $6.25 + $0.50 + $0.70 + $4.50 = $11.95
Notice how access fees and outbound transfer together nearly double the pure capacity charge. This is why a tier comparison before deployment is essential: if access frequency is higher than once a month, S3 Standard may yield a lower monthly bill despite its higher per-gigabyte rate. Use the side-by-side comparison this cost calculator provides to test both scenarios.
Example 3 — High-Volume Data Archive with S3 One Zone-IA
A media company archives processed video renders — data that's reproducible if lost — to minimise long-term spend. They choose S3 One Zone-IA (one zone-ia) because the files can be re-rendered if the single Availability Zone fails. Monthly figures:
- Capacity: 10 TB (10,240 GB) in One Zone-IA at ~$0.01 per gigabyte
- Write requests: 5,000 (bulk ingestion once per week)
- Read requests: 1,000 (rare spot checks)
- Outbound transfer: 10 GB (minimal; renders are consumed internally by servers)
- Capacity charge: 10,240 × $0.01 = $102.40
- Write charge: 5,000 ÷ 1,000 × $0.01 = $0.05
- Read charge: 1,000 ÷ 1,000 × $0.001 = $0.001 ≈ $0.00
- Transfer charge: 10 × $0.09 = $0.90
- Monthly estimate total: $102.40 + $0.05 + $0.00 + $0.90 = $103.35
Compared to holding the same 10 TB in S3 Standard (~$0.023 per gigabyte = $235.52 in capacity charges alone), One Zone-IA delivers meaningful cost savings — over $130 monthly — when the usage frequency is minimal and durability trade-offs are acceptable. For data that's never retrieved (pure cold storage or data archiving), Glacier would reduce the per-gigabyte cost further still, though data retrieval times range from minutes to hours.
How to do a manual calculation vs. using this estimator
A manual calculation requires you to look up the current storage class rate, write rate, read rate, and outbound transfer rate for your chosen zone from the vendor's official reference pages, then apply the formula above. This tool automates calculations by pulling from the public pricing API and applying tiered rates and free tier offsets automatically. The result is a faster, less error-prone approach than spreadsheet work — though you should still open a detailed view in the platform console to confirm final costs once your task is live. Note that pricing occasionally changes, so any estimates — whether from this tool or a manual calculation — are non-binding. Always treat output as a custom price quote for planning purposes, not a guaranteed invoice figure. You can download CSV exports from most calculators or share estimate links with your team to support budget planning and cost management discussions.
For enterprise tasks managed through Terraform or CloudFormation, integrating a cost review step into your CI/CD pipeline — running a scan against your infrastructure-as-code before deploy — catches waste that static estimates miss. Tools like CloudBurn scan live platform accounts to surface spend that accumulates from forgotten resources, helping align your invoiced account with your production budgets. For university or non-profit research data tasks, checking whether promotional credits or academic programs apply before finalising your figures can significantly change the outcome.
Pricing across multi-cloud environments — including Azure Blob and Google Cloud Storage alongside Amazon S3 — follows similar structural logic across this shared cloud infrastructure: data volume, api operations, and outbound transfer. However, provider pricing varies enough that a tool supporting cost comparison across vendors can reveal when an alternative provider offers better value for a specific usage frequency. Whether you're optimising a single-provider stack or evaluating multi-cloud data solutions for scalability, the key is modelling all three cost dimensions — capacity, requests, and outbound transfer — together rather than in isolation. That complete view is what separates a useful storage cost calculator from a misleading one, and it's exactly what this tool is built to deliver.
CapEx, OpEx, Refresh Cycles and Depreciation Defined
Raw vs Usable Cost: Always compare storage cost on a per-usable-TB basis. RAID 6 on an 8-drive group means 25% overhead — a $50/TB array effectively costs $67/TB of usable storage.
PUE (Power Usage Effectiveness): Data centre PUE of 1.5 means for every 1W of IT load, 0.5W of overhead (cooling, lighting, UPS) is consumed. Enterprise data centres average PUE 1.4–1.8.
Cloud Egress Costs: Cloud pricing shown here is storage-only. Data retrieval (egress) adds $0.09/GB from most providers — for large datasets this can dominate costs.
Tape Break-Even: Tape typically breaks even vs disk at multi-petabyte scales when data access frequency is low. Include tape library capex (~$20K–$100K) in TCO for tape-based solutions.