

RAID Rebuild Time Calculator
The RAID Rebuild Time Calculator estimates how long your array will spend in a degraded, data-at-risk state after a drive failure. Enter the Number of Drives, Drive Capacity, Drive Type, and RAID Level, set the I/O Load During Rebuild to reflect production workload competition, and click Calculate Rebuild Time to see estimated rebuild duration, data-at-risk window, and Uncorrectable Read Error (URE) probability with recommended actions. Also see: RAID Calculator.
Estimated Rebuild Duration, URE Risk and Double-Fault Probability
8 × 8 TB RAID 5, 30% production load
Moderate URE riskRebuild duration
degraded and exposed
Effective rebuild speed
after I/O load deduction
Data at risk
usable data on the array
URE probability
chance of a bad sector mid-rebuild
Rebuild window against a 72-hour scale
During these 21.2 hrs the array survives any second failure. Keep a hot spare so the rebuild starts immediately, and schedule it off-peak to raise the effective speed.
| Metric | Value | Notes |
|---|---|---|
| Drive capacity | 8 TB | Per failed drive |
| Base rebuild speed | 150 MB/s | Unloaded sequential read |
| Effective rebuild speed | 105 MB/s | After I/O load deduction |
| Total data read during rebuild | 56 TB from 7 drives | From surviving drives |
| Rebuild duration | 21.2 hrs (21.2 h) | Estimated wall-clock time |
| URE probability | 36.09% at 1 in 10^15 | Chance of unrecoverable read error |
HDD, SSD and NVMe RAID Rebuild Speeds and Estimated Duration
| Drive Type | Base Read Speed | Rebuild Speed (30% load) | 8 TB Drive Rebuild | URE Rate |
|---|---|---|---|---|
| 7200 RPM HDD | 150 MB/s | ~105 MB/s | ~21 hrs | 10^14–10^15 |
| 10K RPM HDD | 200 MB/s | ~140 MB/s | ~16 hrs | 10^15 |
| 15K RPM HDD | 250 MB/s | ~175 MB/s | ~13 hrs | 10^15 |
| SATA SSD | 550 MB/s | ~385 MB/s | ~5.8 hrs | 10^17 |
| NVMe SSD | 3,500 MB/s | ~2,450 MB/s | ~54 min | 10^17 |
URE Rates, RAID 5 vs RAID 6 and the Rebuild Window Risk Window
When a disk fails in your disk array, the clock starts ticking — and the RAID rebuild time calculator above gives you the two numbers that matter most: how long your array will stay in a degraded state, and how likely a double failure or unrecoverable read error is to destroy everything before reconstruction finishes. Whether you manage a homelab network-attached storage system, a production server, or enterprise storage, understanding these numbers before you buy disks or choose a redundancy level is the difference between informed planning and a false sense of security. Use this tool to calculate rebuild times and practice effective risk control before a disk failure forces your hand.
See the RAID Rebuild Time Calculator in Action
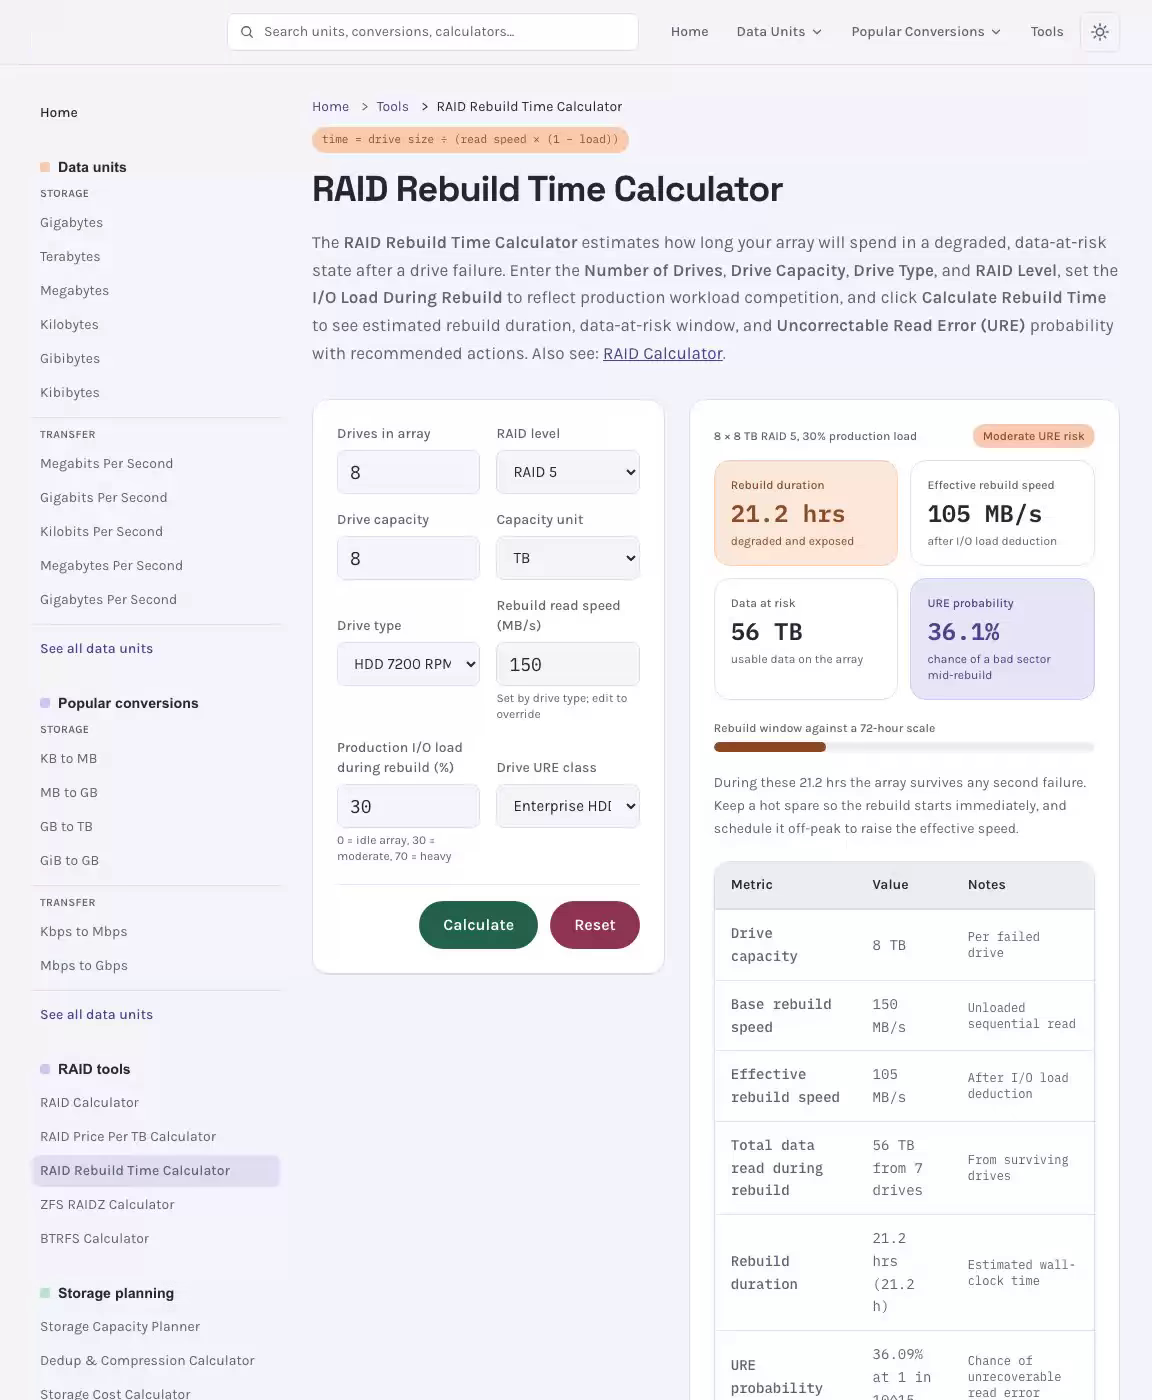
Use the RAID Rebuild Time Calculator to Calculate Rebuild Times and Double-Failure Risk
Reconstruction Settings and Input Fields Explained
Before the calculator can estimate your reconstruction duration and URE probability, it needs accurate values from your specific setup. Here is what each field means and where to find the right number. Related: ZFS RAIDZ Calculator.
| Input / Output Field | Description | Typical Value / Source |
|---|---|---|
| Disk Size | Formatted capacity of each individual storage device in the configuration | e.g., 2 TB, 4 TB, 8 TB — from drive label or manufacturer datasheet |
| Volume Size | Total raw storage contributed by all disks in the redundant volume | Calculated: Disk Size × N |
| Sector Size (bytes) | Physical block size of the disk — affects sectors per disk count | 512 bytes (legacy) or 4096 bytes (4 KB sector / 4096 sector, modern disks) |
| Sectors Per Disk | Total number of sectors on one disk | Disk Size ÷ Sector Size |
| Bits Per Disk | Total bits stored on a single disk; used in URE probability math | Disk Size (bytes) × 8 |
| Bit Error Rate (BER) | Manufacturer-rated unrecoverable read error rate, expressed as 1 error per N bits read | 1014 (desktop/consumer), 1015 (storage-grade), 1016 (enterprise) |
| AFR | Annual Failure Rate — percentage chance a disk fails within a year | 0.5–2% typical; check Backblaze stats or your manufacturer datasheet |
| MTBF | Mean Time Between Failures in hours; inversely related to AFR | AFR ≈ 8760 ÷ MTBF |
| Rebuild Throughput (MB/s) | Sustained sequential read speed of the surviving disks during reconstruction | 80–200 MB/s typical for spinning storage under i/o load |
| Time to Rebuild (hours) | Output: Estimated hours the volume stays in a degraded state | Computed by formula |
| Bits Read During Rebuild | Output: Total bits read from surviving disks to reconstruct missing data | Computed by formula |
| URE Probability | Output: Probability that at least one unrecoverable read error aborts the rebuild | Computed by formula |
| Clean Read Probability | Output: Probability of a successful rebuild with no sector read error | 1 − URE Probability |
| Formatted Capacity | Usable storage available to the OS after redundancy overhead | Varies by level and disk count |
For a realistic reconstruction speed, use the sustained sequential throughput the surviving disks can deliver — not their peak IOPS figure. Under a production load with concurrent I/O, this number can drop significantly below the idle specification. Many administrators use 100–150 MB/s as a conservative baseline for NAS-grade storage like the Seagate IronWolf or WD Red, while server-class disks may sustain higher speeds. Desktop and consumer-class storage often has lower sustained speeds and a higher annual failure rate, making their rebuild hazard considerably worse and data recovery harder to guarantee.
How the Reconstruction Duration and Capacity Calculation Works
The RAID rebuild time calculator uses standard redundancy math derived from manufacturer-published URE rates and basic throughput arithmetic. Two formulas drive everything.
Time to Rebuild (hours):
Where N is the total disk count in the volume and (N − 1) represents the number of surviving members whose data must be read to reconstruct the missing redundancy block and data stripes. Every gigabyte of capacity adds proportionally to the reconstruction duration — it scales linearly with disk size, which is why moving from 2 TB to 8 TB storage quadruples your danger window.
Bits Read During Rebuild:
Bits Read = Disk Size (bytes) × (N - 1) × 8URE Probability During Rebuild — the p(1 URE during rebuild) — uses the exponential (exp formula) approximation based on the read-error rate per bit and total bits scanned:
Where BER is the bit-error-rate denominator (e.g., 1014 for consumer storage, 1015 for NAS-class disks, 1016 for server-grade units). The complement is your clean read probability: the chance of a full, error-free rebuild. This cumulative URE chance rises sharply with larger disks and higher member counts — it is not a remote edge case for large configurations.
Why Reconstruction Duration Matters for Disk Array Failure Risk and Uptime
The moment a disk failure occurs, your volume enters what is called the danger window — the period during which a degraded configuration is one bad sector or one additional disk failure away from total loss. For a single-redundancy level like RAID 5 or raidz1, there is zero fault tolerance remaining. A raid double failure, or a single unrecoverable read error (URE) encountered while trying to reconstruct the missing stripe, causes a fatal event. There is no data recovery without genuine backups, and system uptime cannot be guaranteed.
This is the core reason why vulnerability rises so sharply with disk size. A full reconstruction on a 2 TB disk at 150 MB/s takes roughly 3 hours. The same volume using 8 TB disks takes around 28 hours at the same speed — giving other members of the pool nearly ten times as long to experience a bad sector or die outright. Because annual failure rate is measured per year and storage statistics show that disks which have already seen stress during a rebuild are at elevated hazard, the probability of data loss compounds dangerously over that extended window.
Takeaway: Use this advanced calculator not just to estimate reconstruction hours, but to make an informed decision about which redundancy level, which storage capacity, and what rebuild speed MB/s are acceptable for your availability and data-protection requirements. Consider upgrading from single-parity to dual-redundancy configurations whenever your rebuild windows exceed 12 to 15 hours on large disks. The difference in usable capacity is modest, but the gain in fault tolerance — especially for disks in the 8 to 12 TB range — is enormous.
RAID Rebuild Time Calculator: URE Danger Window and MTTDL by RAID Level
How Redundancy Level Affects Reconstruction Duration and Volume-Loss Probability
Not all configurations carry the same rebuild hazard, and understanding the difference is essential before you plan your storage and buy disks. The table below shows how MTTDL hours and MTTDL years vary across common levels, using a representative configuration of eight 2 TB disks, an annual failure rate of 0.73%, and a read-error denominator of 1014 (standard for desktop storage). MTTDF hours represents the mean time to data failure for that configuration. These figures illustrate why storage planning must account for both the redundancy level and the disk's error rate. See also: IOPS Calculator.
| RAID Level | Formatted Capacity (GB) | MTTDF (hours) | MTTDL (hours) | MTTDL (Years) |
|---|---|---|---|---|
| RAID 0 / raid0 | 11,304.96 | 200,000 | 100,000 | 11.42 |
| RAID 1 / raid1 | 5,652.48 | 13,434,368,631 | 6,717,184,315 | 766,801 |
| RAID 10 / raid10 | 5,652.48 | 13,434,368,631 | 6,717,184,315 | 766,801 |
| RAID 5 / raid5 | 9,420.80 | 268,687,372 | 257,956,342 | 29,447 |
| RAID 6 / raid6 | 7,536.64 | 705,008,830,143 | 611,961,229,787 | 69,858,587 |
| RAID 50 / raid50 | 7,536.64 | 3,358,592,157 | 2,915,122,583 | 332,776 |
| RAID-Z3 / raidz3 | 5,652.48 | 4,677,209,141,893,574 | 140,704,374,998,038,832 | 16,062,143,264,616 |
The MTTDL years gap between single- and dual-redundancy configurations is stark. RAID 5 uses single redundancy — lose one disk, and the volume has no remaining fault tolerance. Any sector read error on the surviving members becomes a URE abort that destroys the entire volume. RAID 6 uses double-parity protection, meaning a URE during reconstruction is a survivable event: the second redundancy set can compensate for the flawed sector and the process continues. This is the core argument for double-parity configurations in any environment with storage larger than 4 TB, and a key reason a raid double failure scenario is far less catastrophic with dual redundancy.
The table below shows the probability of data loss over time by redundancy level — a view of loss probability that helps with long-term storage management and capacity planning decisions. Values represent the cumulative chance of total volume loss at each year mark:
| RAID Level | 1 Year | 2 Years | 3 Years | 4 Years | 5 Years | 6 Years | 7 Years | 8 Years | 9 Years |
|---|---|---|---|---|---|---|---|---|---|
| RAID 0 | 0.73% | 1.45% | 2.17% | 2.88% | 3.58% | 4.27% | 4.96% | 5.64% | 6.32% |
| RAID 1 | <0.001% | <0.001% | <0.001% | <0.001% | <0.001% | <0.001% | <0.001% | <0.001% | <0.001% |
| RAID 10 | <0.001% | <0.001% | <0.001% | <0.001% | <0.001% | <0.001% | <0.001% | <0.001% | <0.001% |
| RAID 5 | 0.003% | 0.006% | 0.010% | 0.013% | 0.016% | 0.019% | 0.022% | 0.026% | 0.029% |
| RAID 6 | <0.001% | <0.001% | <0.001% | <0.001% | <0.001% | <0.001% | <0.001% | <0.001% | <0.001% |
| RAID-Z3 / raidz3 | <0.001% | <0.001% | <0.001% | <0.001% | <0.001% | <0.001% | <0.001% | <0.001% | <0.001% |
| RAID 50 | 0.001% | 0.002% | 0.003% | 0.004% | 0.005% | 0.006% | 0.007% | 0.008% | 0.009% |
Single-Parity vs Dual-Parity Rebuild Hazard: Worked Examples with Real Storage Sizes
The following three examples illustrate how dramatically storage capacity, member count, and reconstruction speed interact to determine your rebuild odds and clean-rebuild probability. Use these as benchmarks when comparing your own parameters to known reference points. These scenarios also demonstrate the value of a ure risk calculator for evaluating configurations before committing to hardware.
Example 1 — Single-Parity Volume with Five 8 TB Disks at 150 MB/s
- Identify inputs: Storage capacity = 8 TB (8 × 1,099,511,627,776 bytes), N = 5, Rebuild Speed = 150 MB/s, read-error denominator = 1014 (consumer storage)
- Calculate data scanned during reconstruction: Bits Read = 8,796,093,022,208 × 4 × 8 = 2.81 × 10¹⁴ bits
- Apply reconstruction duration formula: Rebuild Time = (8,796,093,022,208 × 4) ÷ (150 × 1,048,576 × 3600) ≈ 61.7 hours
- Calculate URE probability: P(URE) = 1 - e^(-2.81) ≈ 93.9%
- Result: Your volume reconstruction odds are grim — a single-redundancy rebuild across five 8 TB storage units takes over 61 hours, with nearly a 94% chance of encountering a hard error or silent error that aborts the process entirely. This is a high-hazard configuration that demonstrates why single-parity setups should not be used with large storage without a strong backup strategy and attention to performance during the rebuild window.
Example 2 — Dual-Parity Volume with Six 4 TB Disks at 150 MB/s
- Inputs: Storage capacity = 4 TB, N = 6, read-error denominator = 1015 (NAS-grade storage like Seagate IronWolf or Toshiba N300), Rebuild Speed = 150 MB/s
- Data scanned during reconstruction (double-redundancy reconstructs one disk from five surviving members): Bits Read = 4,398,046,511,104 × 5 × 8 = 1.76 × 10¹⁴ bits
- Reconstruction duration: Rebuild Time = (4,398,046,511,104 × 5) ÷ (150 × 1,048,576 × 3600) ≈ 38.4 hours
- URE probability with storage-grade read-error denominator of 1015: P(URE) = 1 - e^(-0.176) ≈ 16.2%
- Result: Even with a 16% chance of encountering a sector read error, the dual redundancy in RAID 6 (or raidz2) means that a URE during reconstruction is a survivable event — the second stripe compensates and rebuilding continues. Volume loss only occurs if a second member disk fails simultaneously. The WD Red and similar NAS-class storage with 1015 read-error denominators meaningfully improve data integrity over consumer units. The usable capacity is 16 TB — a reasonable safety margin for most network-attached storage environments.
Example 3 — Single-Parity Volume with Twelve 14 TB Disks at 80 MB/s (High-Hazard Scenario)
- Inputs: Storage capacity = 14 TB, N = 12, read-error denominator = 1014 (consumer storage), Rebuild Speed = 80 MB/s (degraded volume under production I/O)
- Data scanned during reconstruction: Bits Read = 14 × 1.0995 × 10¹² × 11 × 8 = 1.35 × 10¹⁵ bits
- Reconstruction duration: Rebuild Time = (15.39 × 10¹² × 11) ÷ (80 × 1,048,576 × 3600) ≈ 560.6 hours
- URE probability: P(URE) = 1 - e^(-13.5) ≈ 99.999%
- Result: A virtually certain reconstruction failure. With twelve 14 TB storage units at a slower 80 MB/s rebuild speed — realistic for a production volume with random reads from other workloads — this configuration is nearly guaranteed to suffer a fatal event before reconstruction completes. The combination of 125 TB of raw volume, slow throughput, and consumer-grade error rates makes this one of the most dangerous setups possible. Moving to a dual-redundancy striped configuration with raidz2 or triple-parity raidz3, upgrading to server-grade storage with a 1016 read-error denominator, or adding a standby spare to trigger immediate restoration are all essential for storage reliability at this scale.
Single-Parity vs Dual-Parity: Which Redundancy Level Should You Choose Based on Storage Capacity?
The answer to which redundancy level is appropriate depends directly on your storage capacity and the reconstruction window that size implies. A general guideline based on standard reconstruction math:
- Disks ≤ 2 TB: Single-parity (raidz1) is reasonable with NAS-grade storage rated at 1015. Monitor with SMART tests and run regular disk scrub cycles to catch flawed sectors early.
- Disks 2–8 TB: Dual-parity (raidz2) strongly recommended. The 8 TB reconstruction window at 150 MB/s exceeds 28 hours, creating an unacceptable danger window on single-redundancy volumes. Use Synology SHR-2 or equivalent double-redundancy configurations for network-attached storage devices.
- Disks > 8 TB: Dual-parity, striped dual-parity, or triple-parity raidz3 required for acceptable storage reliability. Consider mixed storage sizes carefully — per-disk sizing affects usable capacity and fill percentage. Server-grade storage with 1016 error denominators reduces the read-error rate expected during reconstruction by an order of magnitude over desktop units.
A standby spare is also highly effective at reducing reconstruction hazard: when a disk failure is detected, the system immediately begins rebuilding onto the spare, dramatically shortening the time the volume spends in a degraded state and protecting uptime. A cold spare sitting on a shelf requires a human to intervene before reconstruction starts, adding hours or days to the danger window. In either case, redundant storage is not a substitute for backups — it does not protect against ransomware, accidental deletion, or controller malfunction. Genuine off-site backups remain essential for full data recovery and protection.
ZFS Resilver vs Block-Level Reconstruction: Speed and Approach Differences
If you are running ZFS (via raidz1, raidz2, or triple-parity raidz3), the rebuild process is called a ZFS resilver rather than a conventional block-level reconstruction. The key distinction is that ZFS only resilvers used blocks — it reconstructs missing data only for blocks that actually contain data, not the full storage capacity. On a half-full pool, a resilver may read and write significantly less than a full reconstruction would require. This is called block-by-block restoration: the system reads only the used blocks tracked in its metadata, skipping free space entirely.
By contrast, traditional sector-level redundancy (hardware controllers, Linux mdadm, Unraid redundancy checks, SHR) must read every sector on every surviving member to reconstruct the failed unit — it has no concept of which blocks are used versus empty. This means a sector-level rebuild on a 16 TB disk will always read and process the full 16 TB worth of data regardless of fill percentage, while a ZFS pool of the same capacity may only process half as much when half-full. This makes ZFS-style resilvers faster in practice on partially-filled volumes, though duration still scales with the volume of used data and fragmentation within the pool can reduce sequential throughput.
Both approaches remain vulnerable to additional disk failure during the process. ZFS adds data-integrity checksumming at the block level, catching silent errors that a conventional storage controller would silently mishandle — making data integrity substantially better in ZFS environments. For homelab and network-attached storage deployments using Unraid, Synology SHR, or similar software-defined platforms, understanding whether your system uses sector-level or ZFS-style reconstruction directly affects which estimates from the RAID rebuild time calculator are most relevant and how you should interpret the output.
Regardless of platform, the practical steps for reducing reconstruction hazard and maintaining system uptime remain consistent: choose dual-parity over single-parity for storage over 2 TB, prefer NAS-grade or server-class disks with a lower read-error rate over consumer units, maintain a standby or replacement disk ready, run periodic scrub and SMART tests to identify flawed sectors before they surface during a rebuild, keep the volume's I/O load low during the process to maximise throughput, and always maintain genuine backups independent of your redundancy configuration. The RAID rebuild time calculator on this page gives you the data you need to make those decisions confidently — before a disk failure forces your hand.
URE Probability, Drive Failure Rates and Rebuild Assumptions
- Rebuild times assume sequential read throughput. Random I/O workloads reduce effective rebuild speed by 30–60%.
- RAID 6 provides a second parity drive, allowing one additional drive failure during rebuild without data loss. Always use RAID 6 for HDD arrays with drives larger than 4 TB.
- Hot spares reduce rebuild start latency from hours (manual replacement) to seconds (automatic rebuild trigger).
- URE probability formula: P ≈ 1 − (1 − 1/URE_rate)^(total_bits_read). For total bits read: surviving_drives × capacity_bytes × 8 bits.
- Enterprise storage controllers throttle rebuild I/O to 20–30% of drive bandwidth to limit production impact, significantly extending rebuild time.
- RAID 10 rebuilds only need to read from a single mirror partner drive, making it far faster and safer than RAID 5/6 for the same drive capacity.
RAID Rebuild Time Calculator: Frequently Asked Questions
3 questions Quick answers about the RAID Rebuild Time Calculator and how its results are calculated.
-
How long does a RAID 5 rebuild take?
RAID 5 rebuild time depends on drive capacity and rebuild throughput. A 4 TB HDD rebuilding at 100 MB/s takes about 11 hours. A 16 TB HDD at 80 MB/s under load takes over 55 hours. NVMe SSDs rebuild in minutes due to 2,000–5,000 MB/s sequential throughput.
-
What is RAID rebuild throughput?
Rebuild throughput is the effective speed at which data is read from surviving drives and written to the replacement. It depends on drive type (HDD vs SSD), RAID level overhead, and concurrent I/O load. Typical values: 7200 RPM HDD 60–100 MB/s, SATA SSD 200–400 MB/s, NVMe SSD 1,000–4,000 MB/s.
-
What is URE risk during RAID rebuild?
URE (Uncorrectable Read Error) risk is the probability of encountering an unrecoverable disk sector during the rebuild process. Consumer HDDs (10^14 URE rate) in large arrays have very high URE risk — over 90% for 6+ drive RAID 5 with 8 TB drives. Enterprise HDDs (10^15) and SSDs (10^17) are significantly safer.