

SSD Endurance Calculator
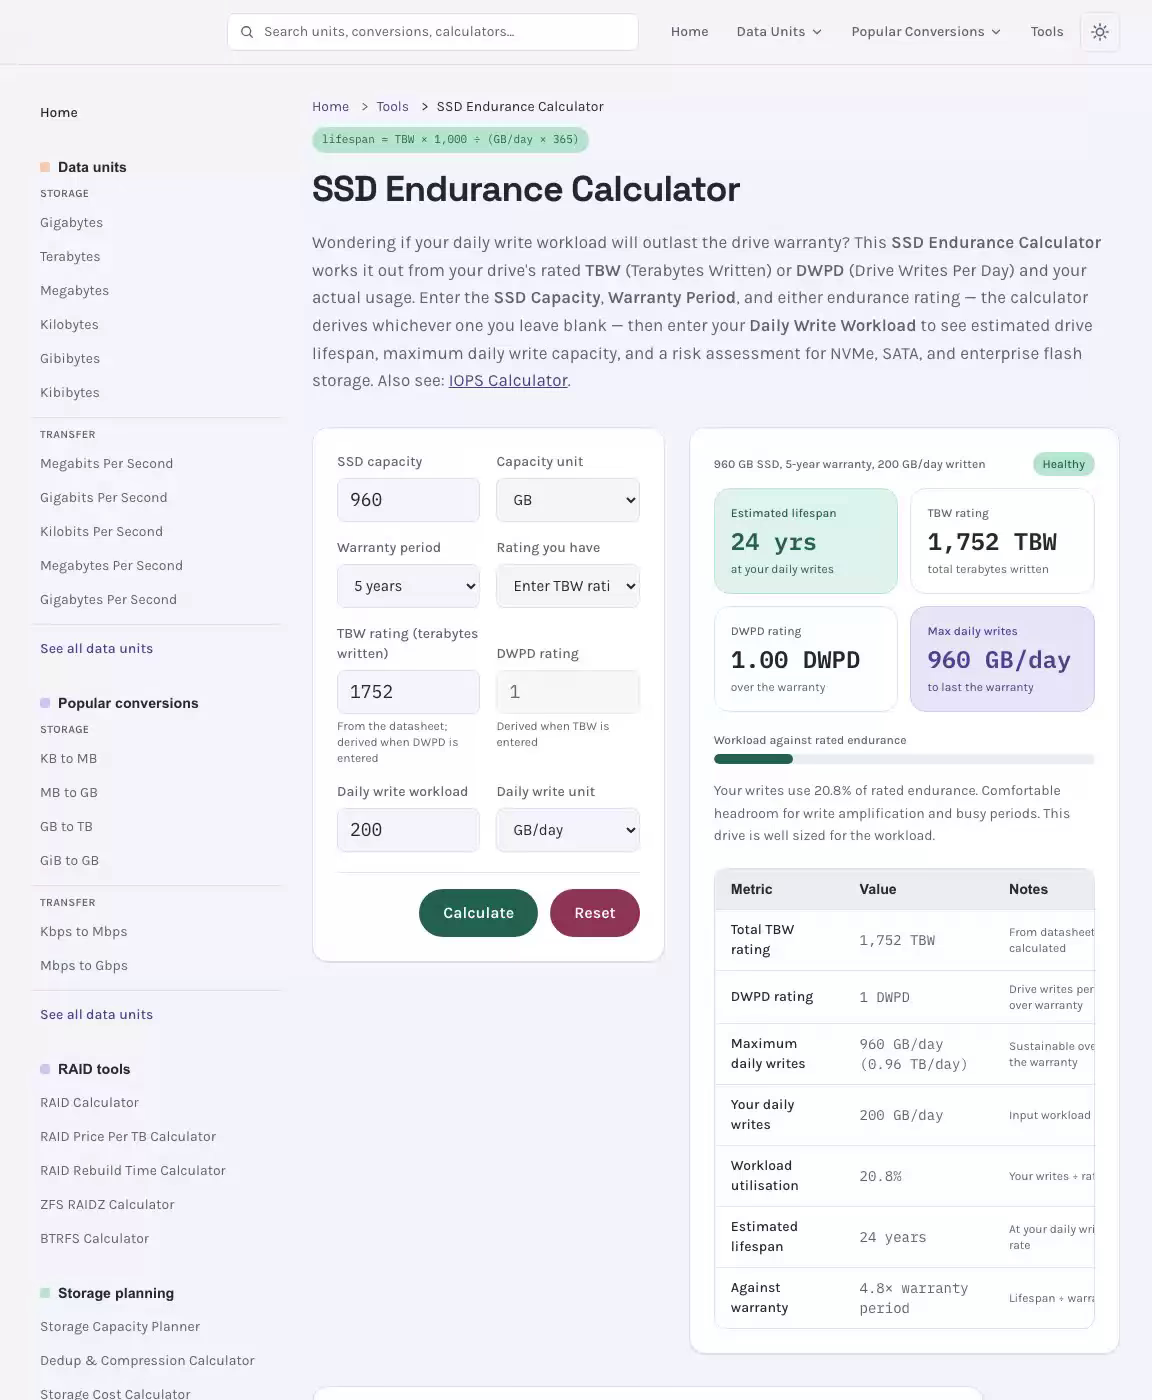
Wondering if your daily write workload will outlast the drive warranty? This SSD Endurance Calculator works it out from your drive's rated TBW (Terabytes Written) or DWPD (Drive Writes Per Day) and your actual usage. Enter the SSD Capacity, Warranty Period, and either endurance rating — the calculator derives whichever one you leave blank — then enter your Daily Write Workload to see estimated drive lifespan, maximum daily write capacity, and a risk assessment for NVMe, SATA, and enterprise flash storage. Also see: IOPS Calculator.
Results
960 GB SSD, 5-year warranty, 200 GB/day written
HealthyEstimated lifespan
at your daily writes
TBW rating
total terabytes written
DWPD rating
over the warranty
Max daily writes
to last the warranty
Workload against rated endurance
Your writes use 20.8% of rated endurance. Comfortable headroom for write amplification and busy periods. This drive is well sized for the workload.
| Metric | Value | Notes |
|---|---|---|
| Total TBW rating | From datasheet / calculated | |
| DWPD rating | Drive writes per day over warranty | |
| Maximum daily writes | Sustainable over the warranty | |
| Your daily writes | Input workload | |
| Workload utilisation | Your writes ÷ rated | |
| Estimated lifespan | At your daily write rate | |
| Against warranty | Lifespan ÷ warranty |
Client, Enterprise and Data Center SSD DWPD and TBW Ratings
| SSD Type | NAND Type | Typical DWPD | Use Case | Example Workloads |
|---|---|---|---|---|
| Consumer | TLC / QLC | 0.1 – 0.5 | Desktop, laptop | OS boot, general files |
| Prosumer NVMe | TLC | 0.5 – 1 | Workstation | Video editing, dev environments |
| Enterprise Read-Intensive | TLC | 1 – 3 | Read-heavy servers | Web serving, read caching, VDI boot |
| Enterprise Mixed-Use | MLC / TLC | 3 – 10 | Balanced I/O | OLTP databases, virtual machines |
| Enterprise Write-Intensive | MLC / SLC | 10 – 25+ | Write-heavy servers | Write logs, OLTP WAL, HFT, caching tier |
| Enterprise NVMe Optane | 3D XPoint | 60+ | Ultra-low latency | In-memory DB persistence, storage-class memory |
What TBW, DWPD and P/E Cycles Mean for SSD Longevity
Every time your system writes data, it nudges your SSD one step closer to the end of its usable life cycle — but how far away that end actually is depends entirely on your real-world write workload versus the device's rated TBW. This SSD endurance calculator gives you a precise, data-driven estimate of your device's longevity in years so you can make confident flash storage planning decisions, choose the right device for your anticipated workload, and avoid costly information loss from unexpected device failure. Whether you're a casual laptop user, a video editor, or an IT professional managing server capacity in a data center environment, matching your GB/day write rate against a device's write endurance rating has never been more straightforward.
See the SSD Endurance Calculator in Action
SSD Endurance Calculator: Inputs, Formulas & Comparison Results
The ssd endurance estimator above accepts your device's core SSD endurance specification and your daily write volume, then instantly calculates how long the device will last before exhausting its rated write capacity. You can compare up to three devices side-by-side to evaluate which model offers the best fit for your anticipated write volume. Below is a summary of the key input fields and what each one means:
- SSD Capacity (GB) — the formatted disk size of your solid-state device, which anchors every durability conversion formula.
- TBW — the manufacturer's rated Total Terabytes Written, the primary ceiling for most consumer and prosumer devices.
- DWPD — Drive Writes Per Day, an alternative rating normalised to device size over a specified coverage term.
- PBW — Petabytes Written, equivalent to TBW expressed in petabytes; used for high-durability server-class SSDs.
- GB/day (Data Written / Day) — your average write volume measured in gigabytes written per day; the single most important real-world input.
- Write IOPS — input/output operations per second for write operations; useful for volume estimation in database or server environments.
- Block Size — the transfer size used in each I/O operation; affects how Write IOPS translates to a write data rate in MB/s.
- Write Data Rate (MB/s) — average sustained write throughput, used to cross-check GB/day figures derived from IOPS and block size.
- Required Useful Life (yr.) — the minimum number of years you need the device to remain operational; used to back-calculate required TBW or DWPD. This required useful life period is the foundation of all JEDEC-aligned planning formulas.
Advanced Volume Controls: Block Size & Write IOPS
When you know your capacity requirements at the I/O level, you can derive GB/day from Write IOPS and Block Size using the conversion formula below. This is particularly valuable in data center and server contexts where volume input comes from disk performance monitoring tools rather than simple file-copy estimates.
For example, 5,000 write IOPS at a 4 KB block size yields approximately 1.65 GB/day — well within the ssd write capacity of even a budget consumer device. For a database server generating 50,000 write IOPS at a 16 KB block size, the figure climbs to roughly 66 GB/day, making DWPD the binding constraint for device selection rather than raw TBW.
The custom WAF (Write Amplification Factor) field lets you account for the internal write amplification that occurs when the SSD's controller rewrites more data than the host originally sent. A WAF of 1.0 means no amplification; typical consumer scenarios see WAF values between 1.1 and 3.0, while mixed random write scenarios can push WAF above 5.0. Adjusting this value gives you a more realistic host-side write picture.
Volume Controls & TBW-Based Lifespan Formula
The core lifespan formula used by this tool is straightforward. Given a device's rated TBW in terabytes and your GB/day average write rate, the projected life in years is:
This is the same conversion formula used across the industry and defined under the JEDEC standard JESD218, which specifies how total bytes written must be measured and reported by manufacturers. Note that 1 TB = 1000 GB and 1 PB = 1000 TB, so a PBW value in petabytes written must be multiplied by 1,000,000 before dividing by your daily write rate × 365 days to yield years. Running this formula over 365 days per year gives you the annualised projection used throughout this tool.
DWPD Calculation from TBW and Device Size
When you know a device's rated TBW, its size in GB, and the intended coverage term in years, you can derive DWPD — the number of full device writes per day permitted within that coverage lifespan:
Where T is the required useful life period in years. Conversely, if you know your target DWPD, you can calculate the minimum TBW the device must carry:
And to convert a TBW value into PBW (i.e., a PBW value or TBW PB expression):
These durability conversion formulas cover every transition between rating units — DWPD, GB/day, TBW TB, and PBW — making this tool a full endurance unit conversion reference as well as a life calculator.
GB/day Results & Device Comparison Table
After entering your Anticipated Volume and SSD Specifications for each device, the calculator outputs a comparison table showing projected service life side-by-side. The example below illustrates three representative scenarios — a consumer laptop user, a video editor, and a database server — to demonstrate how bytes written per day scales the time to reach TBW:
| Device | TBW | DWPD (5-yr term) | GB/day | Estimated Life (years) |
|---|---|---|---|---|
| SSD #1 — 500 GB Consumer NVMe | 150 TBW | 0.16 DW/D | 10 GB/day | ~41 years |
| SSD #2 — 2 TB Prosumer NVMe | 600 TBW | 0.16 DW/D | 100 GB/day | ~16 years |
| SSD #3 — 3.84 TB Enterprise U.2 | 7,000 TBW | 1.0 DW/D | 500 GB/day | ~38 years |
SSD #1 (consumer laptop): At just 10 GB/day on a 150 TBW device, the projected life exceeds 41 years — far beyond the manufacturer's coverage term. Even aggressive burst writing won't threaten this device's write endurance within any realistic ownership period, confirming it's more than sufficient for everyday computing.
SSD #2 (video editor): Writing 100 GB/day on a device with 600 TBW yields roughly 16 years of projected life. This is comfortable, but during heavy project phases where higher daily write bursts occur regularly, monitoring cumulative bytes committed via S.M.A.R.T. tools is prudent. The device's DWPD of 0.16 is adequate for sustained prosumer scenarios but not a substitute for a unit rated at 1 DW/D or above.
SSD #3 (database server): At 500 GB/day on a server-class 3.84 TB NVMe device with a 7,000 TBW rating, the raw lifespan calculation shows ~38 years. However, in a data center environment with intensive random write scenarios, the WAF can easily reach 3–5×, effectively multiplying host-side write volume and reducing service life. For this class of device, DWPD — not raw TBW — is the correct metric for capacity planning and procurement decisions.
How SSD Useful Life Calculator Metrics Are Defined: TBW, DWPD & PBW
Understanding the rating parameters your device reports — and what they actually measure — is essential for interpreting this useful life calculator's output correctly. Flash memory stores data by trapping electrons through an insulator in floating-gate or charge-trap transistors arranged in a transistor grid. Every program/erase cycle forces electrons through the insulator, and over time this insulator degrades, reducing the cell's charge-holding capacity and eventually causing bit errors. This physical degradation is the root cause of all flash storage longevity limits and is the primary driver of the failure rate observed in heavily written devices. Related: Storage Capacity Planner.
Modern solid-state devices are built around an electronic controller — an integrated circuit that manages all I/O between the host and the underlying memory chips. The controller implements wear-balancing algorithms, background reclamation, and ECC to extend the service life of the device far beyond what raw P/E cycle counts would suggest.
TBW — Total Terabytes Written Over a Coverage Term
TBW (Total Terabytes Written, sometimes expressed as total bytes written or TB written) is the primary specification used by virtually every SSD manufacturer. It is formally defined by the JEDEC standard JESD218 as the cumulative amount of data that can be written to the device before it may no longer meet the durability specifications laid out in that standard. Once a device reaches its TBW value, the manufacturer's coverage typically expires on durability grounds — though the device often continues to function in a read-mostly capacity well beyond that threshold.
The type of memory used determines the raw P/E cycle budget, which directly sets the TBW ceiling. SLC (single-level cell) stores one bit per memory cell and supports up to 100,000 program/erase iterations per cell, sometimes reaching even higher counts in industrial-grade parts. MLC (multi-level cell) stores two bits per cell and typically supports around 10,000 program/erase iterations. Enterprise MLC (eMLC) is a binned and validated variant rated for 3,000 to 10,000 such iterations. TLC NAND (triple-level cell) stores three bits per cell and is typically rated for 1,000 to 3,000 program/erase iterations. Some QLC memory (four bits per cell) drops as low as 300 such iterations. Server-class SLC parts, used in specialised flash cards and some high-durability products, can reach 50,000 iterations in practice. Modern 3D V-NAND architectures stack memory cells vertically to improve density while partially recovering P/E counts versus planar TLC.
A typical consumer 256 TBW rating on a 512 GB TLC device translates to roughly 0.27 DWPD over a five-year term — more than sufficient for general-purpose computing. High-durability prosumer devices commonly carry 300 TBW, 450 TBW, or ratings equivalent to 600 TBW, while server NVMe units for data center use can carry ratings of 7,000 TBW or higher, equivalent to several values expressed in petabytes written.
DWPD — Drive Writes Per Day Explained
DWPD (Drive Writes Per Day, also denoted DW/D) normalises the rating to the device's size, expressing how many times you can rewrite the entire device each day over the coverage term before exhausting rated capacity. A DWPD of 1.0 means you can rewrite data daily — effectively filling the device's entire size once per 24-hour period — for the full coverage term. A value of 0.1 means you can write 10% of the device's size each day. Server scenarios for databases and transaction logs typically require at least 1–3 DWPD; consumer laptops seldom exceed 0.1–0.2 DWPD in normal use.
The conversion formula between GB/day and DWPD for a device with size S in GB is:
So a 500 GB device writing 50 GB/day operates at 0.1 DWPD — a light scenario even for a unit with a modest rating. This conversion lets you cross-check manufacturer specs: if a device is advertised at a five-year term with 0.3 DWPD and a size of 1 TB (1,000 GB), the implied TBW is TBW = (0.3 × 1000 × 5 × 365)/(1000) = 547.5 TB — approximately 600 TBW at rounded specification. The DWPD calculator and TBW calculator modes of this tool handle exactly this kind of back-calculation automatically.
PBW, Rating Parameters & Mean Time Between Failures (MTBF)
PBW (Petabytes Written) is simply TBW expressed in petabytes rather than terabytes, used when the raw TBW figure is large enough that terabyte notation becomes unwieldy. A PBW value of 1 PB equals 1,000 TB of bytes committed. High-durability server units with 7,000 TBW ratings carry a PBW of 7.0, meaning totals expressed in petabytes written remain in the single digits for even the most demanding data center scenarios. The PBW calculator mode of this tool converts between TBW TB and TBW PB instantly.
Mean Time Between Failures (MTBF) is a distinct dependability metric from write endurance. While TBW measures how much data the memory can absorb before degradation, MTBF is a statistical evaluation of random failure probability expressed in hours — essentially a measure of the failure rate of random component faults. Premium consumer solid-state devices are typically rated at half a million hours MTBF, while server units often carry ratings of 2.5 million hours or more. Importantly, MTBF is derived from small sample sizes tested under accelerated stress conditions — it is a dependability index, not a promise that any individual device will operate for that many hours. Device failure can occur before TBW limits are reached due to random component faults, firmware bugs, power events, or physical damage.
The table below summarises typical rating ranges across device classes, giving you a quick reference for volume estimation and capacity planning:
| Device Class | NAND Type | Typical TBW (1 TB device) | Typical DWPD (5-yr) | Estimated Longevity at 20 GB/day |
|---|---|---|---|---|
| Consumer (laptop/desktop) | TLC / QLC NAND | 150–300 TBW | 0.08–0.16 DW/D | 20–41 years |
| Prosumer (workstation/NAS) | MLC / TLC NAND | 300–600 TBW | 0.16–0.33 DW/D | 41–82 years |
| Server (data center) | eMLC / SLC NAND | 3,000–7,000+ TBW | 1.0–10.0 DW/D | 400–958 years* |
*At 20 GB/day; server-class devices are sized and selected for scenarios 10–100× higher than this figure. DWPD is the practical constraint, not theoretical service life.
Key Factors That Determine SSD Useful Life & Long-Term Reliability
Your device lifespan is not determined by TBW alone. The firmware and hardware features built into your solid-state unit work continuously to extend service life beyond what raw program/erase counts would imply. Understanding these mechanisms helps you interpret your ssd endurance calculator results in context and make better decisions about device maintenance, replacement timing, and disk performance in both consumer and server environments. See also: Backup Capacity Calculator.
Wear Leveling, Bad Block Management & Cell Durability
Wear leveling is the foundational firmware technique that extends the service life of flash memory by distributing write and erase operations as evenly as possible across all memory cells in the device. Without it, the operating system would repeatedly overwrite data to the same logical block addresses (LBA), concentrating P/E cycles on a small cluster of storage cells and rapidly exhausting them while the majority of the device remained lightly used.
There are two variants. Dynamic wear leveling distributes writes only among blocks that are currently free and available for allocation — it is faster but leaves cold data in place, allowing those blocks to sit at low cycle counts indefinitely. Static wear leveling goes further, periodically relocating infrequently changed data from low-cycle blocks to high-cycle ones to achieve a more uniform distribution of P/E operations across the entire device. Most modern solid-state units implement both, with the controller selecting the appropriate strategy based on cycle count data stored per storage block.
Bad block management addresses the reality that flash memory contains both early bad blocks (factory-identified during production) and later bad blocks (cells that fail during normal operation after repeated P/E cycles degrade the oxide layer). The device's electronic controller maintains a mapping table that transparently remaps failed physical memory blocks to reserve blocks from the spare pool. There are two primary remapping strategies: the reserve block method (allocating a dedicated reserve region at manufacture) and the skip block method (skipping detected bad blocks during sequential writes). When the reserve pool is exhausted, the unit typically enters a read-only mode to protect remaining data before complete failure.
Over-provisioning — reserving a portion of total memory size that is invisible to the host — serves both bad block management and background reclamation. It provides headroom for block distribution, reduces the write amplification factor, and supports sustained peak throughput under heavy scenarios. Server-class solid-state units typically carry 28% or more over-provisioning compared to the 7–10% common in consumer devices.
TRIM Command, Background Reclamation & Write Amplification Factor
Flash memory cannot overwrite data in place at the page level — to update a page, the controller must erase the entire storage block containing it (typically 256–512 pages), then rewrite the updated content. This erase-before-write constraint creates write amplification: for every 1 GB of data the host writes, the device may internally write 2–5 GB or more to physical memory, accelerating P/E cycle consumption beyond what GB/day figures suggest. The write amplification factor (WAF) quantifies this ratio, and it is the reason the custom WAF input in this durability estimator meaningfully changes your lifespan estimate.
The TRIM command (formally the ATA TRIM or NVMe DSM Deallocate command) allows the operating system to notify the device which deleted pages and invalid data pages are no longer needed. When TRIM is enabled, the controller can proactively erase those regions during idle periods via background reclamation, keeping large pools of clean blocks ready for incoming writes. Without TRIM, reclamation must read, merge, and rewrite entire blocks containing a mix of valid and stale data, dramatically increasing the write amplification factor and accelerating cycle consumption. On modern Windows, macOS, and Linux systems, TRIM is typically enabled by default for solid-state devices — but confirming this is an important part of best practices.
Error Correction Code (ECC) is the final line of defence against cell degradation. As repeated write and erase operations wear the oxide layer surrounding floating-gate or charge-trap cells, the cells' charge-holding capacity degrades, making it harder to distinguish stored bit values reliably. The device's integrated circuit continuously applies ECC algorithms to detect and correct bit errors before they propagate into data corruption. When such errors exceed the ECC's correction capability for a given block — a condition signalled by rising uncorrectable error counts — the controller flags those blocks for retirement, contributing to degradation of available space over time. Modern server-class solid-state units use LDPC (Low-Density Parity-Check) ECC capable of correcting many hundreds of flipped bits per codeword, extending device durability well beyond what older BCH-based ECC permitted.
Device Age, Usage Patterns & SSD vs. HDD Reliability
The age of the device compounds with cumulative writes in ways that raw TBW calculations don't fully capture. Flash memory that has accumulated many P/E cycles becomes more susceptible to read disturb errors (where reading one cell slightly stresses adjacent cells), data retention degradation (charge leaks faster from worn cells), and increased read latency. These effects accelerate after the device passes roughly 70–80% of its rated ceiling, making proactive replacement important in mission-critical contexts — even if the device hasn't literally hit its TBW limit.
Solid-state device dependability under normal consumer scenarios is generally excellent. Most users writing 10–30 GB/day will exhaust their coverage term long before approaching their device's TBW ceiling, meaning the unit will typically last 5–10 years before it's replaced for throughput or size reasons rather than cycle exhaustion. However, in write-intensive roles — video editing, virtual machine hosting, database transaction logs, array configurations in a server — daily write volumes can reach 100–500 GB, making DWPD the dominant selection criterion.
Compared to a traditional hard disk drive (HDD), a solid state device offers significant advantages in throughput and disk performance: faster data access thanks to internal parallelism across multiple memory chips, superior boot speed, lower power consumption and energy efficiency, compact size, and immunity to mechanical failure since there are no spinning platters or moving read heads. A comparison on the dependability dimension is nuanced: spinning-platter devices can fail at any moment due to head crashes, bearing failures, or other mechanical faults, whereas solid-state units degrade predictably over program/erase cycles and typically provide warning signals via S.M.A.R.T. data well before catastrophic data loss. Both storage device types benefit from regular data backup to protect against device failure or corruption events.
SSD Endurance at a Glance: Summary & Bottom Line on Drive Lifespan
Putting it all together: this ssd endurance calculator gives you the most important number in storage planning — time to reach TBW under your real-world GB/day write rate. The bottom line is that for the vast majority of users, device longevity is determined by age and obsolescence long before cycle exhaustion becomes a concern. A consumer laptop user writing 10–20 GB/day on a unit with a 150 TBW or 256 TBW rating will almost certainly replace it for size or throughput reasons after 5–7 years, decades before the TBW ceiling is approached.
The picture shifts significantly for power users and data center scenarios. Video editors, machine learning engineers, and developers running frequent database migrations can easily sustain 100–300 GB/day of bytes committed — volumes that push into the hundreds of terabytes annually. For these users, selecting a unit with an appropriate DWPD rating — not just a high raw size — is the critical decision this tool enables. An average daily write volume of 200 GB/day on a unit rated at only 300 TBW yields a sobering projected life of just over 4 years; a unit rated at an amount equivalent to 600 TBW under the same average write scenario doubles that to over 8 years.
In IT infrastructure and data center contexts, endurance specifications directly affect procurement cycles, total cost of ownership, and capacity management planning. Using this tool as a volume calculator during the selection process — entering each candidate device's ssd specification alongside your measured or estimated anticipated write volume — lets you compare the device life impact of different TBW and DWPD ratings before committing to a purchase. The ssd comparison table output makes that decision transparent and auditable.
Write Amplification, Overprovisioning and Workload Caveats
- TBW ratings assume the manufacturer's specified write amplification factor (WAF). Actual lifespan may be shorter if your workload has a higher WAF due to small random writes or frequent overwrite patterns.
- Write amplification from RAID parity, snapshots, garbage collection, and OS journal operations increases effective writes beyond the application-level figure. Add 1.5–3× overhead for typical enterprise storage stack.
- SSD SMART attribute 0xF1 (Total Bytes Written) reports cumulative write volume — monitor this to forecast remaining lifespan.
- Exceeding TBW rating does not cause immediate failure but may trigger read-only mode on some enterprise SSDs. Replace proactively at 80% TBW consumption.
- DWPD ratings are calculated over the warranty period at standard operating temperature (0–70°C for commercial, –40–85°C for industrial). High-temperature operation reduces effective P/E cycle count.
SSD Endurance Calculator: Frequently Asked Questions
3 questions Quick answers about the SSD Endurance Calculator and how its results are calculated.
-
How do I calculate SSD lifespan from TBW?
Divide the TBW rating by your daily write workload in TB. For example, a 1000 TBW SSD with 1 TB/day writes will last approximately 1000 ÷ 1 = 1000 days ≈ 2.74 years.
-
What is the difference between DWPD and TBW?
DWPD (Drive Writes Per Day) and TBW (Terabytes Written) are equivalent endurance ratings. TBW = DWPD × capacity (TB) × warranty years × 365 days. A 1 TB SSD with 1 DWPD over 5 years = 1 × 1 × 5 × 365 = 1,825 TBW.
-
What DWPD do I need for a database workload?
OLTP database transaction logs and write-intensive workloads typically require 3–10 DWPD. Mixed-use workloads use 1–3 DWPD. Read-intensive boot/OS drives need only 0.3–1 DWPD. Always measure actual write I/O before selecting an SSD endurance tier.